| The McMillan Options Strategist Weekly |
| By Lawrence G. McMillan |
Published
09/11/2009
|
Options
|
Unrated
|
|
|
|
The McMillan Options Strategist Weekly
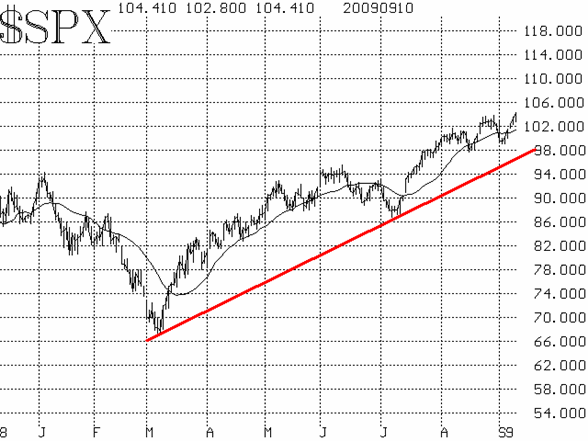
The chart of $SPX is in Figure 1. The dominant factor is the intermediate-term rising trendline, connecting the March and July lows. That trend line is currently at 970, so any corrections that occur but hold above that point would just be corrections in a bullish trend. There is also support at 990 and 980 -- the lows of the last two minor corrections. Meanwhile, $SPX broke out to new highs today, making both new closing and intraday highs.

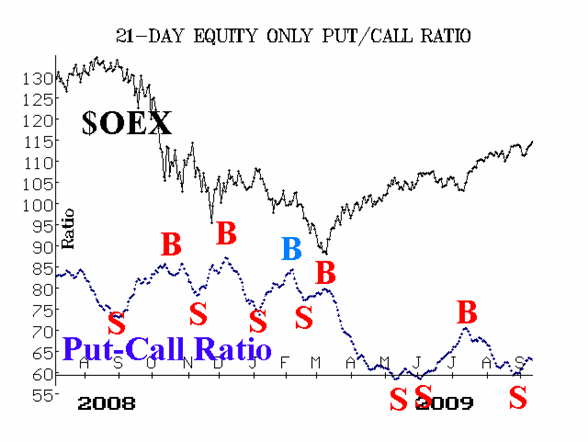
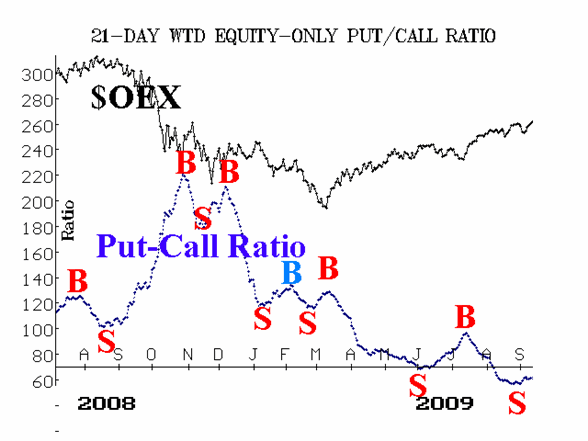
The equity-only put-call ratios generated sell signals a couple of weeks ago, and have more or less clung to them ever since.

Market breadth was quite negative for four days, during the last correction (which encompassed about 50 $SPX points, from high to low). But breadth has surged during the last week, and the breadth sell signals that existed have been canceled.

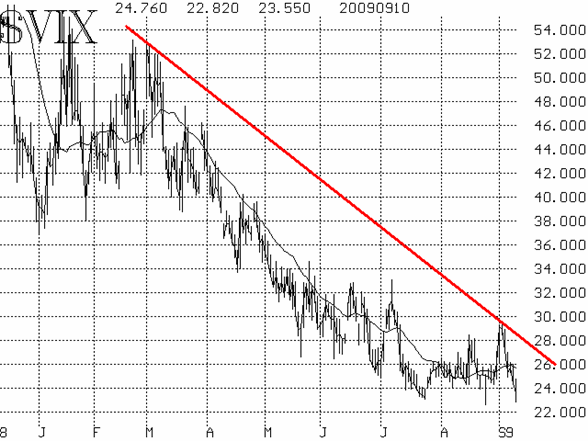
The volatility indices ($VIX and $VXO) tried to reverse their downtrends during the last correction, but it was not to be. At this time, they have now both made new lows for this move, and that reaffirms the fact that they are in a downtrend. In turn, that is a bullish indicator for the stock market.

In summary, the fact that the $SPX chart is positive is the dominant feature of this market. Until that changes, there is no reason It would seem that the under-invested institutions will have to get sucked into the market before a meaningful correction can take place.
Lawrence G. McMillan is the author of two best selling books on options, including Options as a Strategic Investment, recognized as essential resources for any serious option trader's library.
|