| Corcoran Technical Trading Patterns For September 14 |
| By Clive Corcoran |
Published
09/13/2009
|
Stocks
|
Unrated
|
|
|
|
Corcoran Technical Trading Patterns For September 14
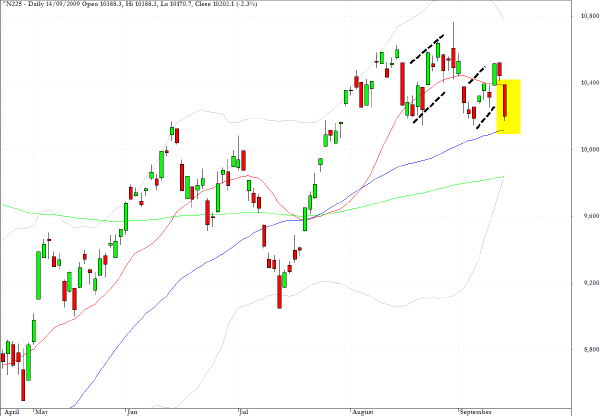
The Nikkei 225 continued the sell-off from Friday with another 2.3% drop in Asian trading today.
This is being attributed to the weakness of the US dollar against the yen, but as the chart suggests there are negative pullback channels emerging and the pattern would become decidedly bearish if the Nikkei were to fail to hold above the 200-day EMA around 9800.
As suggested in Friday’s commentary, the US currency appears to be gaining some ground against most other currencies and the growing strength of the yen does lend support to the risk aversion scenario which may become a pre-occupation of macro traders again.
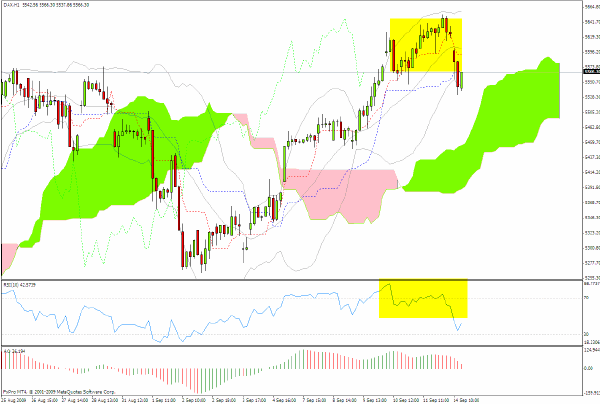
The chart below is an hourly intraday chart for the DAX index in Germany and as with many charts at the moment there are some very strong negative divergences where price development is following a very different path to the underlying relative strength and momentum oscillators.
Equity indices have been showing a knack recently of "floating" away from the underlying technical dynamics which are pointing towards corrective action, but based on the premise that there are a lot of constituencies that want to sustain the pleasant mood music of increasing asset values this anomaly could persist for some time. Reviewing the charts from 2007 it really was quite remarkable how the October rally of that year was able to be mounted despite the clear evidence of negative divergences during the late summer and early fall of that year.
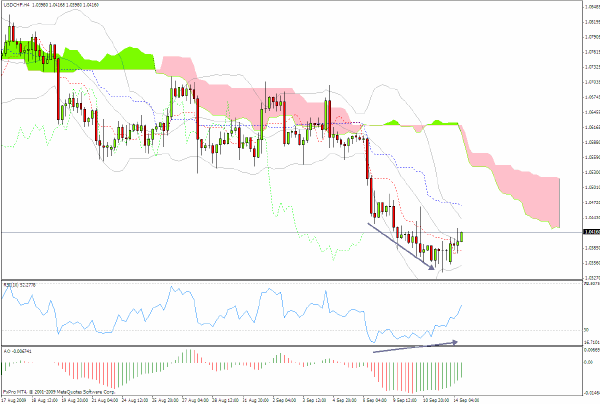
The chart below continues with the theme from Friday’s commentary that there is evidence that the US dollar is gaining some traction across many currency pairs.
The 4-hour chart for the USD/CHF shows that the basing pattern is being maintained.
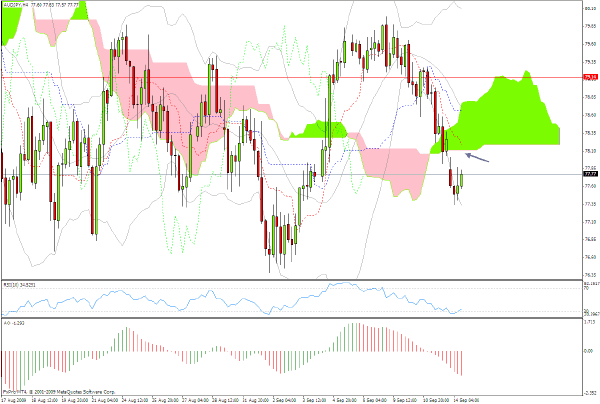
One of the more interesting plays in FX is long yen and short the Australian dollar.
The pair came down to the 77.50 area which I suggested as a target last week, and should we see a rally back towards the green cloud, this would provide another good opportunity to look at the short side (i.e. selling the Aussie for yen) with an eventual target of the early September lows around 76.50.
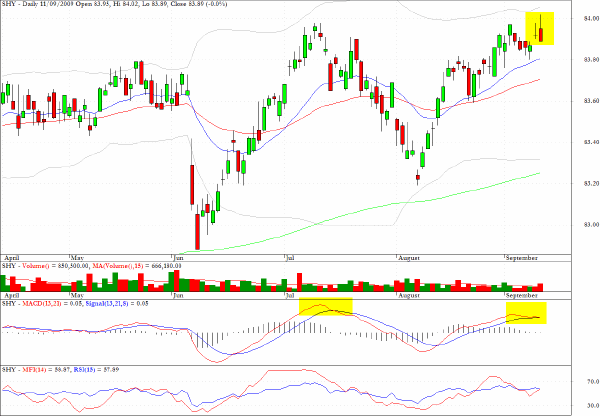
SHY, an exchange traded fund which reflects the Lehman index of 1-3 year Treasury bonds, registered a shooting star pattern and a potential double top in Friday’s trading. There is also a negative MACD divergence.
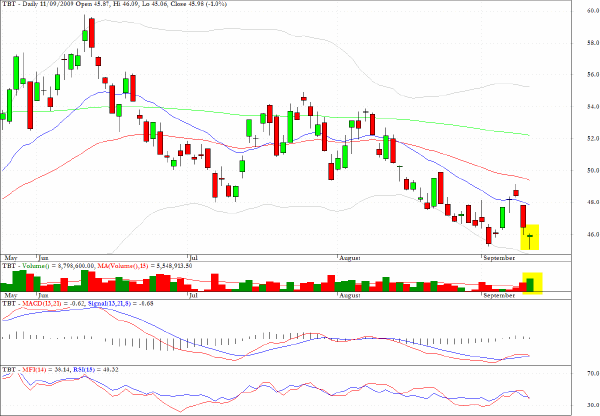
TBT, an exchange traded fund for the longer end of the Treasury spectrum which also tracks yields (i.e. moves inversely to price) registered a tiny hammer candlestick on substantial volume in Friday’s trading.
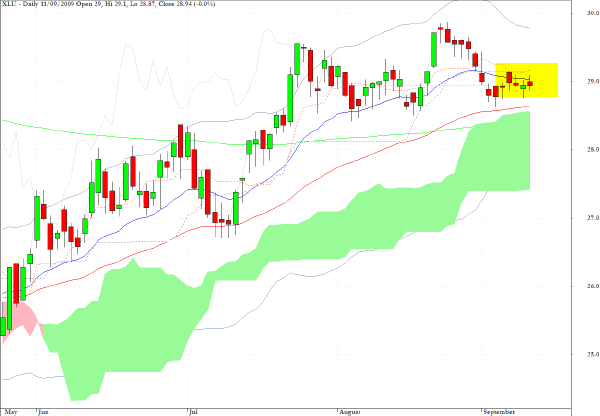
XLU, which tracks the utilities sector, has triggered a signal crossover on the daily Ichimoku chart.
For those wanting to play the short side for the utilities sector with leverage, the fund SDP, also has a positive divergence.
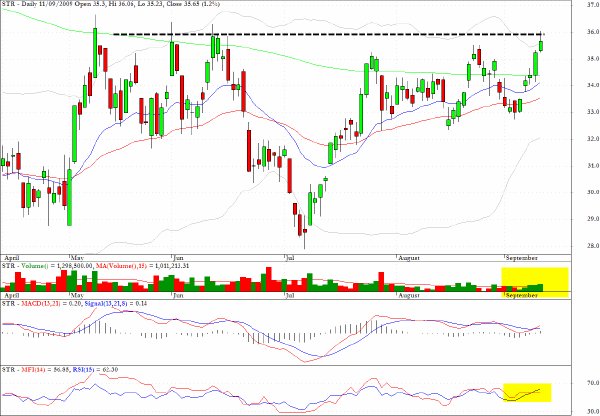
I shall be watching Questar Corp (STR) as there are suggestions that a decisive move above $36 could be a precursor to a breakaway pattern.
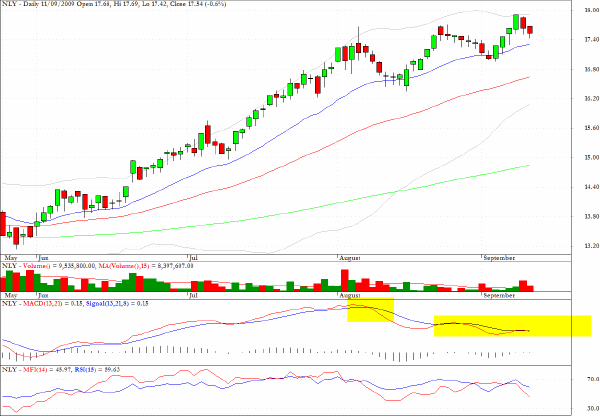
Annaly Capital Management (NLY) is an example of a stock that is floating and has become disconnected from the underlying deterioration in the technical dynamics.
Clive Corcoran is the publisher of TradeWithForm.com, which provides daily analysis and commentary on the US stock market.
|