| Corcoran Technical Trading Patterns For September 17 |
| By Clive Corcoran |
Published
09/17/2009
|
Stocks
|
Unrated
|
|
|
|
Corcoran Technical Trading Patterns For September 17
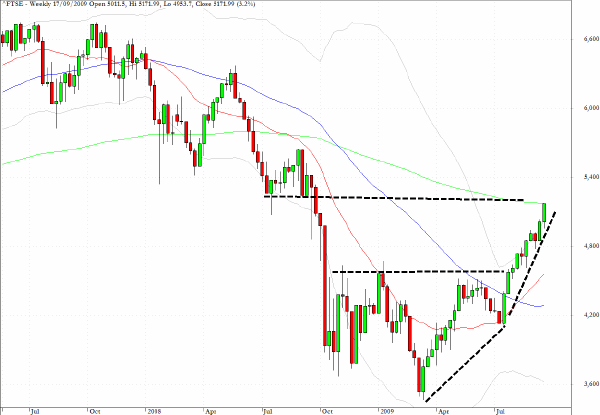
In yesterday’s trading the UK’s FTSE index moved above the 50% retracement swing level and is currently trading around 5160 which, as highlighted on the chart below coincides almost exactly with the 200-week EMA.
The annotations on the chart show two distinct phases to the recovery since March with the first illustrating quite convincingly the initial basing followed by the pullback into a cup and handle formation with subsequent breakaway. Since then the slant of the line through the lows suggests that there has been aggressive buying which is indicative of a market where institutions and even retail investors are buying the dips anxiously so as not to get left behind.
There is little room for any margin of error in this kind of scenario and one senses that while 5240 may be a feasible target in the near term, this market is going to want to take a rest and when it does there could be a swift retreat back towards the 5000 level as a first stop.
It is feasible that some time this year we could see a re-testing of the 4650 region which is marked as the top of the cup and handle pattern and which would represent about a ten percent correction from current levels.

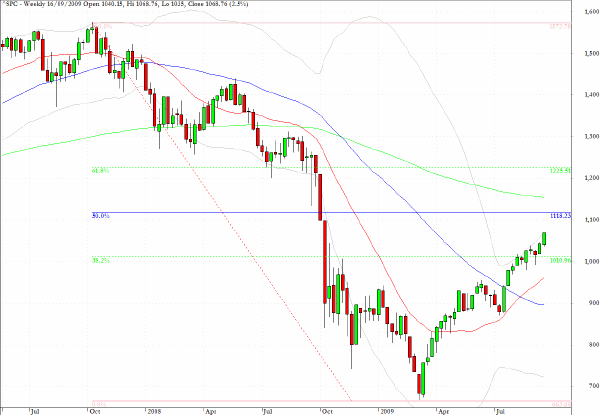
It is becoming increasingly likely that the 1120 level on the S&P 500 is being targeted now by the bulls which would represent the tracing back of one half of the swing move since the October 07 high and the 09 low.
The last four or five percent may be quite volatile, and of course we may not got there before a correction sets in.
This reminds me of the adage attributed to Lord Rothschild that one of his secrets to investment success was that he always sold too early.

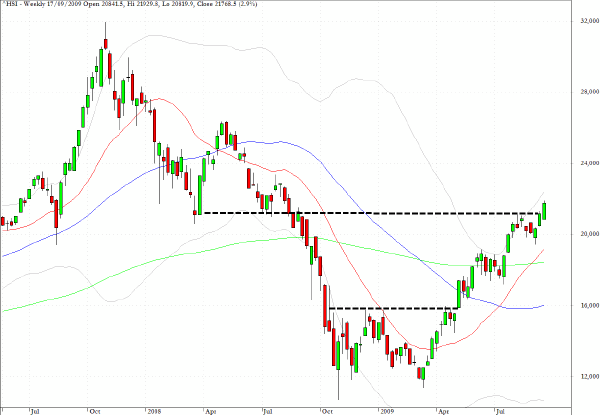
The Hang Seng Index (HSI) is blazing a trail and reinforces the view that the animal spirits are becoming more enlivened as we head towards the fourth quarter.
Interestingly, the chart pattern has very similar characteristics to the pattern revealed on the chart for the FTSE and one suspects that we are either on the verge of another major break away to the upside or, should there be a violation of the steep uptrend line through recent lows, we could see some fear re-enter the market (which would actually be a more sober development and suggest that the current bullish sentiment does not go into a super mania phase).

I have to confess that I have been overly optimistic about a potential recovery of the US dollar.
I feel that a correction for equities is imminent which would also see a rebound in the dollar and there are positive divergences on longer time frame intraday charts suggesting that the sell-off of the US currency is losing momentum as we continue to make new 2009 lows in certain pairs.
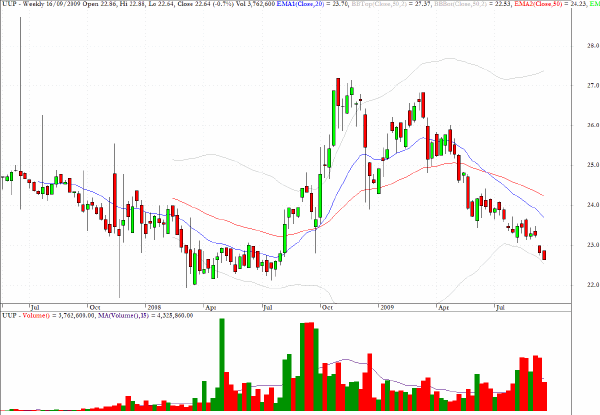
For reference sake I have included the weekly chart for the sector fund, UUP, which tracks the greenback against a basket of currencies.
The lows seen in April March now seem to be on the horizon, and in the meantime I would suggest that the key currency pairs to watch for indications that the selling of the dollar may be reaching a crescendo are the AUD/USD and the USD/CHF.
One of the factors that is making a general play on a dollar index problematic is the out of sync performance of the Japanese yen which now seems to be following its own agenda.
Normally I would recommend monitoring the AUD/JPY for signs that there might be some unwinding of carry trade positions but the somewhat erratic strengthening of the yen against the dollar is making the charts on this pair too noisy to be reliable at present.

Clive Corcoran is the publisher of TradeWithForm.com, which provides daily analysis and commentary on the US stock market.
|