| The McMillan Options Strategist Weekly |
| By Lawrence G. McMillan |
Published
09/18/2009
|
Options
|
Unrated
|
|
|
|
The McMillan Options Strategist Weekly
The breakout to the upside this week was virtually a "melt-up," as stock and option volume were extraordinary. I have never seen speculative statistics such as were generated from Wednesday's trading. In one of our daily newsletters, Daily Volume Alerts, we noted that on Wednesday over 370 stocks traded double their average option volume (normally less than 100 do). Furthermore, over 100 of those had very strong stock volume patterns and traded at prices not seen in at least the last 100 trading days (i.e., they qualified as breakouts of a sort). Moreover, stocks with extraordinarily strong stock volume patterns -- of which there are usually about 2 or 3 in given day -- numbered 42. We have been publishing Daily Volume Alerts for over 15 years, and I have been using similar volume statistics for trading going back over 25 years, and I have never seen a day like that.
Just remember to stay on top of all of your positions. Don't fool yourself into thinking you've suddenly become a genius; don't confuse brains with a bull market.

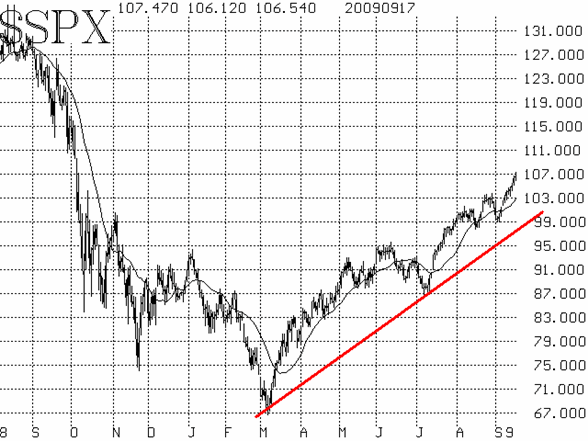
The $SPX chart is clearly bullish. The trend line connecting the March and July lows is now at about 980. So a correction could extend all the way back to that level (we don't expect one will) and the $SPX chart would still be bullish. If there is pullback, it will likely meet support at one of the higher support levels: 1035, 1020, or 1000.

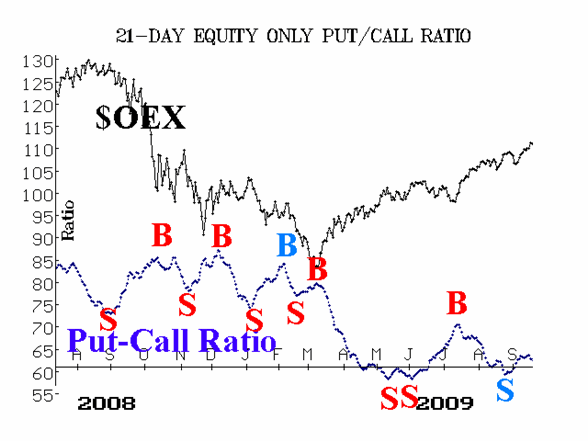
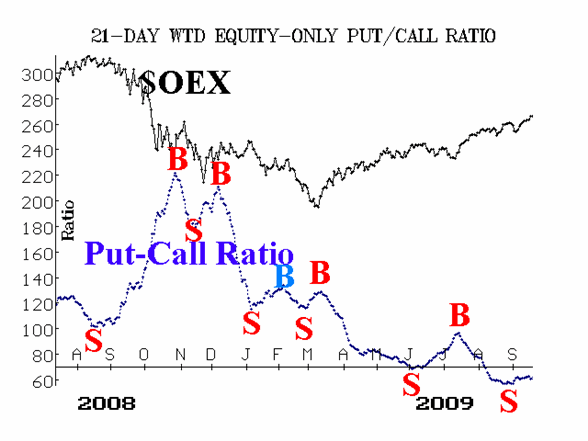
Equity-only put-call ratios remain on sell signals, as they continue to rise.
Market breadth has been extremely strong. This is, as always, a two-edged sword. On the one hand, it's bullish because so many stocks are participating in the rally. On the other hand, it represents a massive oversold condition that could easily be conducive to sharp, but short-lived corrections.

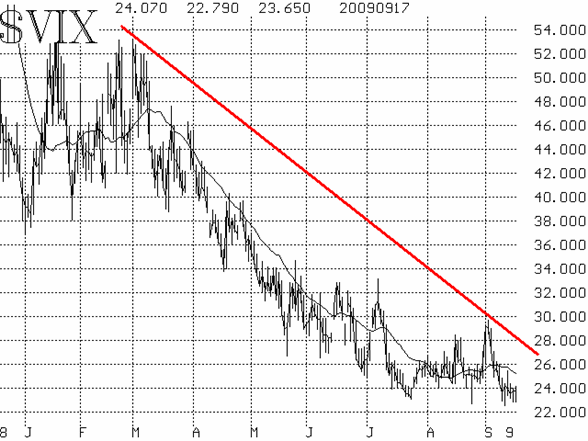
The volatility indices ($VIX and $VXO) are near their lows, and so the trend of volatility is down -- and that is bullish for stocks.

In summary, the intermediate-term indicators are bullish. Overbought conditions indicate that a sharp, but short-lived correction could be possible at any time. Conversely, buyers seem to emerge at the slightest of pullbacks, indicating that there are still plenty of under-invested accounts out there.
Lawrence G. McMillan is the author of two best selling books on options, including Options as a Strategic Investment, recognized as essential resources for any serious option trader's library.
|