| Sector Spotlight On REIT's |
| By Price Headley |
Published
09/18/2009
|
Stocks
|
Unrated
|
|
|
|
Sector Spotlight On REIT's
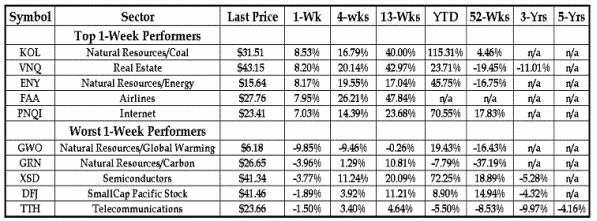
Let's take a look at some of this week's top- and bottom-performing ETF's and ETN's. Keep in mind that we cull the list to avoid duplicate sectors and we toss out Ultra and UltraShort ETF's. Some of these names are lightly traded and may be fairly illiquid. Make sure that you research the holdings and design of these ETFs before considering any trade.
ETF Performance Table

One sector that suffered greatly during the financial meltdown was real estate. With real estate stocks and ETF's having fallen so far, it should be no surprise that this sector has quite a bit of bounce-back potential. Therefore, seeing the Vanguard REIT Index ETF (VNQ) on the list of top-performing ETFs this week wasn't the biggest surprise in the world. This specific ETF normally invests roughly 98% of its assets in stocks issued by real estate investment trusts (REITs) in an attempt to track the investment performance of the MSCI US REIT Index. Among the holdings in this ETF are REIT heavyweights Simon Property Group (SPG), which boasts nearly 9.5% of assets, Vornado Realty Trust (VNO), and Boston Properties (BXP).
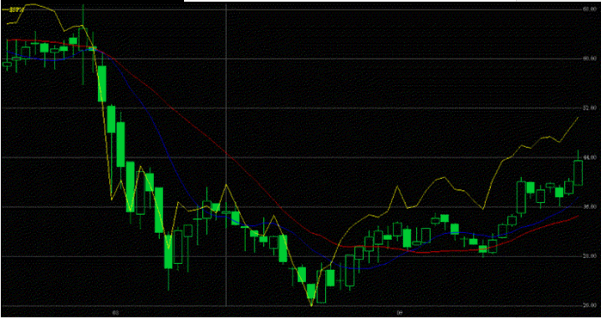
Technically, the real estate market may have found its nadir and could be in the process of working its way higher. This is demonstrated on VNQ's weekly chart. The equity is working its way higher along the support of its 10-week moving average (the blue line), yet it is lagging the broader market (the yellow line, represented by the S&P 500). As the broader market continues to trudge higher (if that is indeed the long-term pattern), the real estate market could follow suit.
VNQ Weekly Chart with SPX

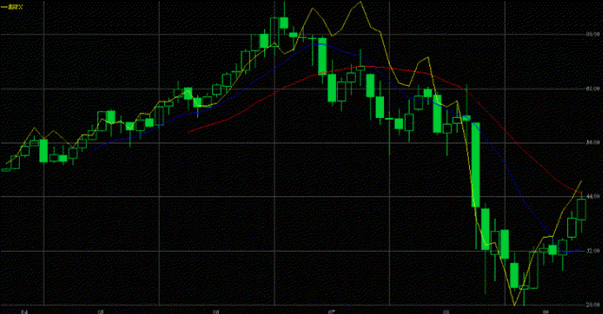
Yes, the $44 level is a bit of a concern, but this is not the only hurdle the VNQ faces. The red line on the monthly chart below is the ETF's 20-month moving average, which lurks slightly north of the 44 level. If VNQ is able to break through the 44 level, this trendline could prove more than the stock can bear. The last time VNQ finished a month atop this trendline was back in 2007.
XSD Monthly Chart with SPX

Price Headley is the founder and chief analyst of BigTrends.com.
|