| Corcoran Technical Trading Patterns For September 21 |
| By Clive Corcoran |
Published
09/21/2009
|
Stocks
|
Unrated
|
|
|
|
Corcoran Technical Trading Patterns For September 21
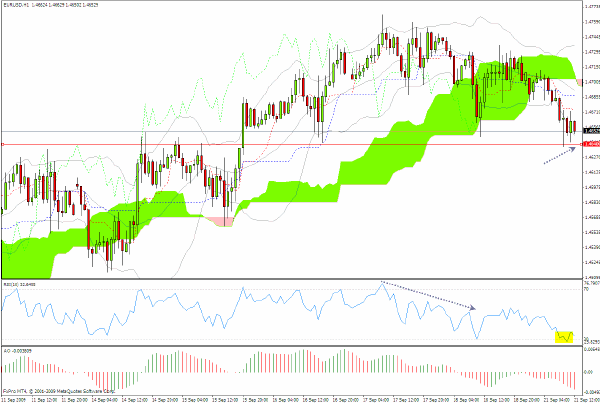
The focus of attention in coming sessions should be on the FX market and the fact that many currency pairs are testing potential support in their recent run-up against the US dollar.
Certainly there is some evidence that the overall forex market may be too short the dollar and that with the possibility at least that the period of super easy monetary policy may be moving towards its grand finale there could be quite a scramble to cover short dollar positions if some current levels do not hold.
In Friday’s commentary I touched on some of these levels and while this is being written the euro is now poised just above a significant recent support level at $1.4640.
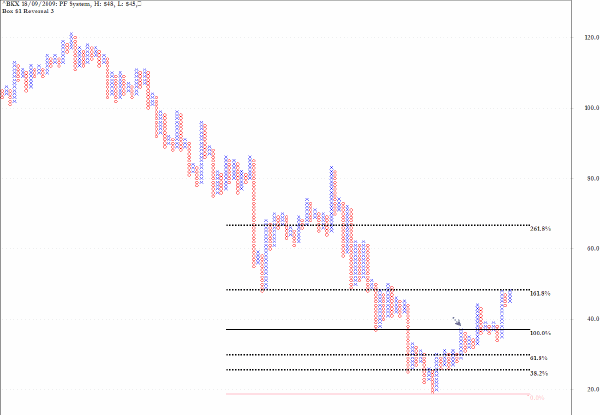
From time to time I look to review point and figure charts for a sense of the price action without the time dimension. For those unfamiliar with the technique there are several good sources that will reveal the basics about the technique and which can be discovered by using your preferred search engine.
The chart below shows the KBW Banking Index (BKX) and I have focused on the recent recovery and established some fibonacci extensions based on a major impulse move from the base.
Interestingly, the current level is at 1.618 times this movement and the 2.618 ratio would take the index to the 68 area approximately.
In the vicinity of the the current area there is some overhead resistance which can be seen by plotting a horizontal line through the red zeroes at the base of several columns.
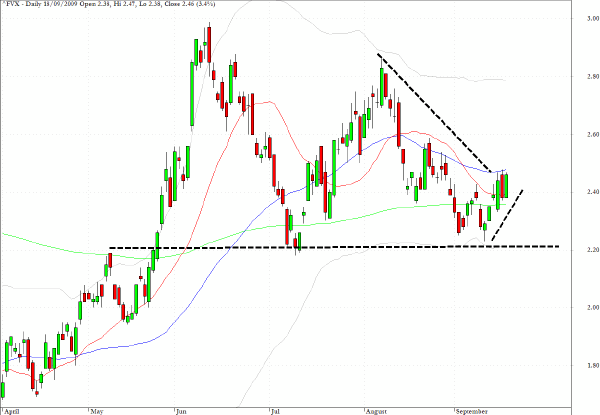
The chart for yields on the five-year Treasury note clearly reveals a fundamental support level at 2.2% and the pattern sketched out indicates a triangular pattern which may be preparing for an upward breakaway as yields move higher.
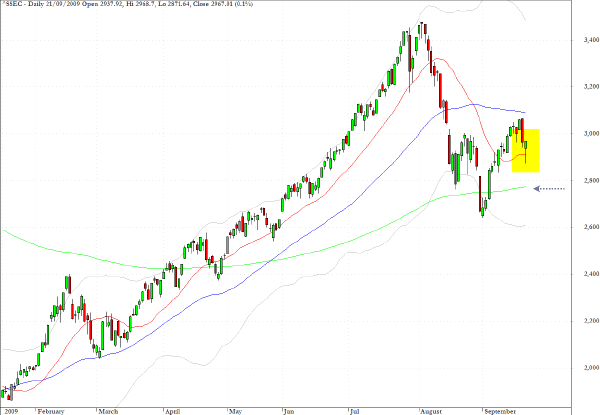
In Friday’s column and on CNBC’s European Closing Bell that afternoon I discussed the technical condition of the Shanghai Exchange (SSEC).
The market made a recovery in to the close of trading during Monday’s session after dropping more than 3% intraday and penetrating below the 50-day EMA (red line).
As I have already cautioned, this index, in my opinion, has the potential to surprise on the downside and I shall be watching the way that the current pattern evolves this week.
It is also worth pointing out that the market will be closed for one week from October 1 for local holiday celebrations.
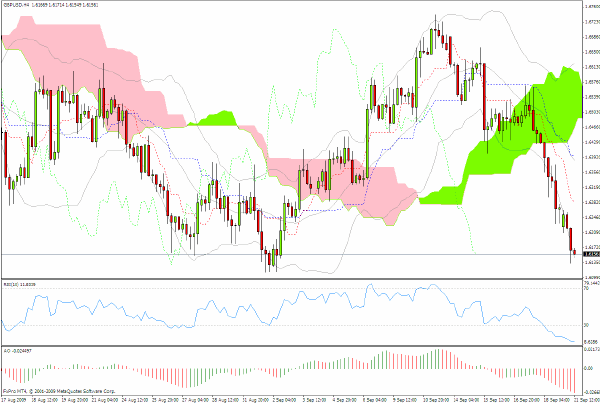
Sterling/dollar is also sitting at the key level of $1.6140, which I discussed on Friday, as this is being written. One would expect a near-term bounce.
Howeve,r if the bounce lacks conviction and we head down towards the more pivotal $1.60 level, many of those who are presently long sterling could start throwing in the towel with an increasing likelihood that this key support level may not hold.
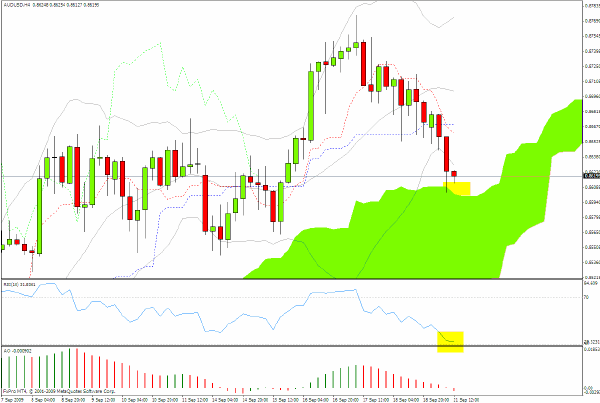
Another currency pair to which I have alluded last week, the AUD/USD, is also positioned at a level where some kind of short-term bounce is to be expected. The overall tone of the market suggests that the Aussie currency may be on the back foot during the course of this week.
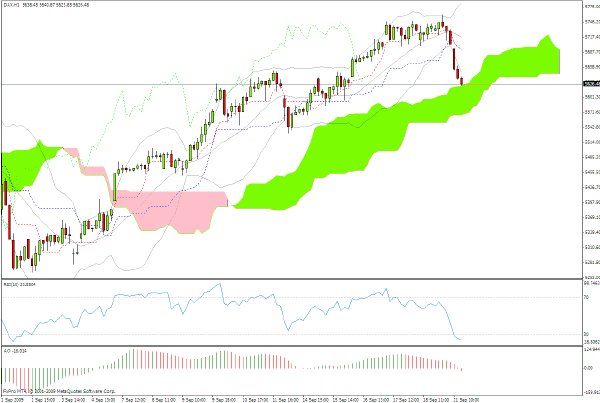
Germany’s DAX index has slumped in European trading on Monday morning but as with the Australian currency the chart suggests that a bounce off the green cloud seems likely, that is providing that the tide has not turned against the long equities and short dollar brigade.
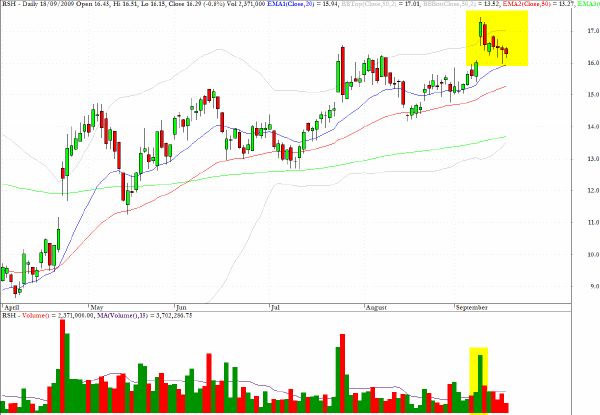
Radio Shack (RSH) has a bullish flag formation.
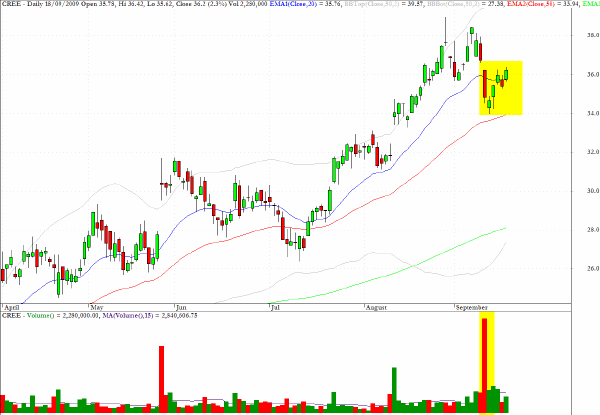
Cree (CREE) has a bear flag formation with quite notable down volume characteristics associated with the down-thrust which created the inverted flag pole.
Clive Corcoran is the publisher of TradeWithForm.com, which provides daily analysis and commentary on the US stock market.
|