About a month ago, we published a Sector Spotlight detailing the charts of crude oil, heating oil, and natural gas. If you remember it, you'll also remember that the basic idea was that energy commodity prices looked like they were hitting a top - at least for the time being. Not wanting to leave it up in the air, I thought it would be worth following up on today.
Since then, those prices have pretty much behaved as we though they might. All three futures contracts have fallen back from the highs that were being hit in late September, and none of them look like they're ready to make a bounce anytime soon.
Is this at odds with pretty much everything you were hearing about oil and gas just a month ago? Yep, it sure is. But, that was the warning we were giving. We're far more interested in what the market is doing, rather than what it says it is doing. In other words, money talks. While pundits, the media, and everybody else said they were looking for oil prices to keep moving higher, there weren't any dollars committed to the idea. That's why prices were topping out.....nobody was actually buying the stuff, so demand was diminishing. Simultaneously, supplies were at least holding steady (despite a couple of hurricanes). The result? Falling commodity prices. That's why we love charts, and are a little distrustful of the media chatter.
Let's just take a look at each of the three charts again.
Crude Oil
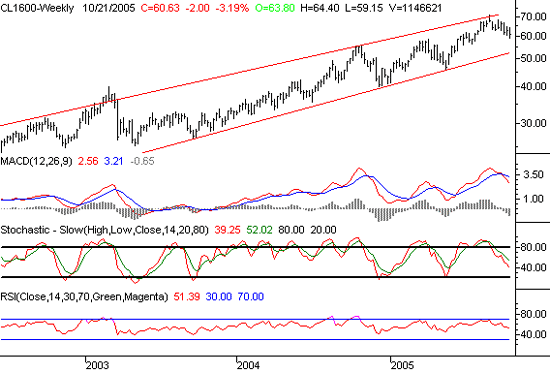
After hitting a high of 70.90 in early September, crude oil futures have been sliding backwards. This is great news for us at the pumps, but may have hurt anyone who was insistent that oil futures would just keep on going. We've seen lower lows five of the last six weeks, and lower closes in four of the last six weeks. And more than that, it doesn't look like crude has found a floor yet. That support line is currently at 52.60 and rising, which is still 8 points away from where oil is right now. We can't really expect to see crude fall under that line, but we've seen this line confirmed as support several times over the last couple of years.
Crude Oil Futures - Weekly

Heating Oil
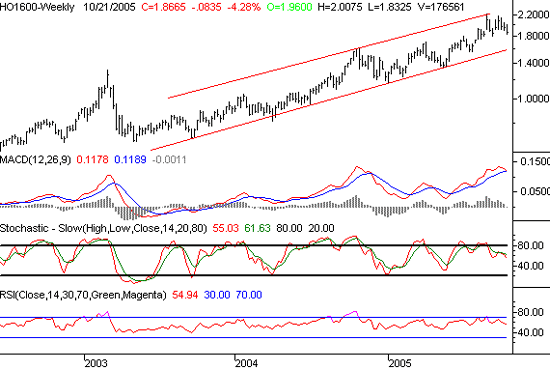
This one looks pretty much like the crude oil chart (and it mostly should), in that it peaked in early September, and has been falling back ever since. Like crude, there's a long-term support line that's been verified a few times in the last couple of years. It's at 1.50 and rising, yet it's still 30 cents under the current price. That leaves a lot of room for more downside movement. Note that we now have a bearish MACD cross, but we still wouldn't get overly bearish until that support level is broken.
Heating Oil Futures - Weekly

Natural Gas
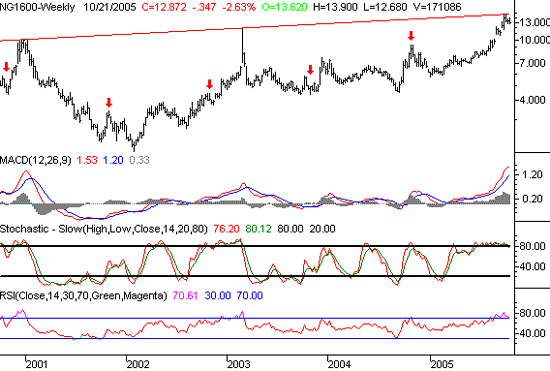
This is our favorite one. Plenty of folks were convinced that the natural gas spike to 14.75 was just the beginning of what was going to be painfully expensive heating costs. We, on the other hand, basically expected to see that spike end as most spikes do - with a reversal. Aiding that expectation was the very long-term resistance line you see on the chart. The precision with which it was touched for the third time in four years is almost scary. But all the same, after running into that resistance, natural gas is inching lower again. (see below for an explanation of the red arrows)
Natural Gas Futures - Weekly

Want to know what the red arrows are? This is for all the folks who are counting on the beginning of winter and cold weather to drive up natural gas prices. The arrows plotted on the chart mark this same week (the week of 10/24/05) for the corresponding week of that particular year. Technically speaking, this is when the cold weather starts to set in, and it's when the gas shortage panic should begin. See anything odd about the chart? In two of the five years, natural gas prices went down in the winter. The point is, the cold-weather-based gas rally isn't dependable enough to bet on.
Price Headley is the founder and chief analyst of BigTrends.com.