| Corcoran Technical Trading Patterns For October 5 |
| By Clive Corcoran |
Published
10/4/2009
|
Stocks
|
Unrated
|
|
|
|
Corcoran Technical Trading Patterns For October 5
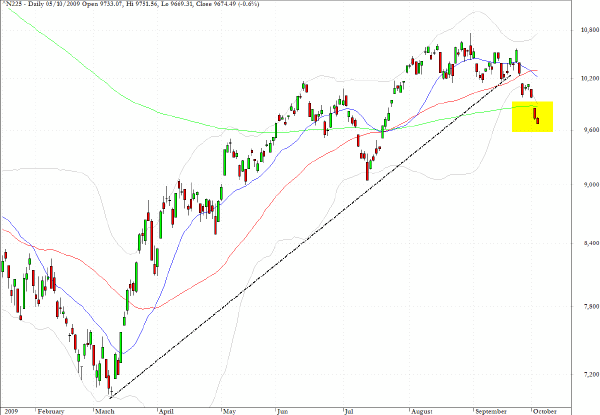
In Asian trading last Friday, the Nikkei 225 broke below two major support levels as the chart below reveals. The index completed its move below all three key moving average levels with a close below the 200 day EMA (the green line on the chart). In addition there is a clear violation of the uptrend line through the lows since the March bottom. The Nikkei continued further down with a more modest drop in Monday’s session but this is a troubling chart and a target zone of 9000 appears likely in the intermediate term.
If the yen continues to strengthen against the US dollar, and if US consumers continue to lose jobs, the outlook for the Nikkei increasingly looks like a prolongation of its 20-year bear market.
On the subject of US non-farm payrolls, it is worth noting that if the one million plus workers that have "left" the US labor force since May (i.e. they are too discouraged to look for work and drop off the official statistics) were added back into the unemployment figure, the U3 percentage would be 10.4%. Even more alarming is the U-6 measure, which provides a better perspective on the under-utilization of the US workforce - which has now moved up to 17%. The BLS also acknowledged that there may be downward adjustments reflecting a further 800,000 plus jobs lost and which would only become part of the official tally next February.
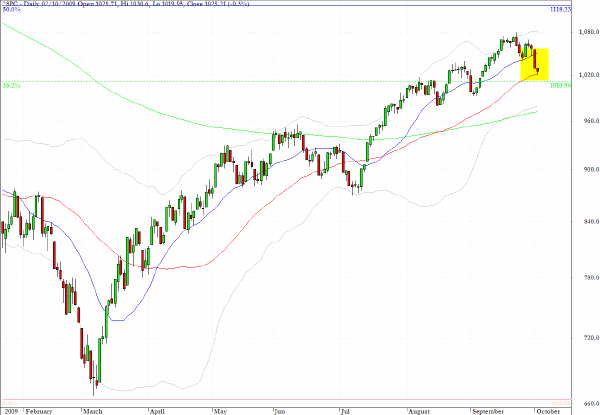
The non-farm payrolls numbers released on Friday were an unqualified depressant for the bullish camp even though the whisper number (should that be the leaked number?) that was circulating during Thursday’s session did most of the damage and Friday’s relatively small drop for the S&P 500 gives new meaning to the notion that markets are forward looking and discount all known information. It’s just a pity that the average punter doesn’t get to see the numbers in advance as well.
The S&P 500 chart certainly looks less worrisome than the Nikkei and the buy on the dips mentality seems to have many adherents. It would not surprise me to see 1200 on the S&P 500 index and yet another return to the 870 level for a key test of the market’s nerve in the coming months.
Which comes first in that sequence I shall leave until my crystal ball provides slightly clearer signals.
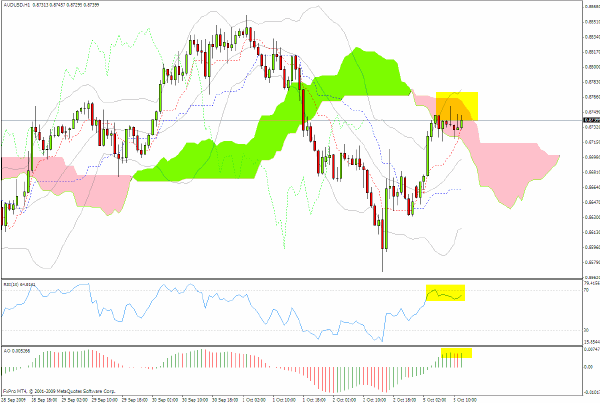
The Australian dollar is always a good barometer to test the strength of the animal spirits but the short-term view based on the hourly chart below is that there are some negative divergences and potential resistance at the top of the pink cloud which could see a retracement of the most recent gains.
As always I would suggest that watching AUD/JPY and AUD/USD can provide good inter-market clues as to the outlook for global equities and the risk appetite of the more adventurous hedge funds.
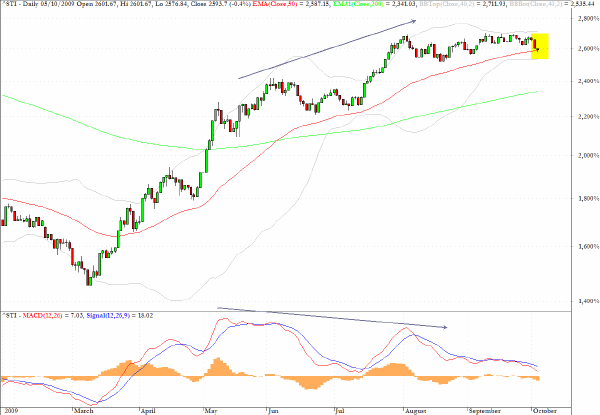
Another of the Asian market indices, the Singapore Straits Times Index (STI), is also indicating that a long-standing trendline of support through the lows since March is in jeopardy.
Also very noteworthy on the chart is the large-scale MACD negative divergence throughout Q3 of this year.
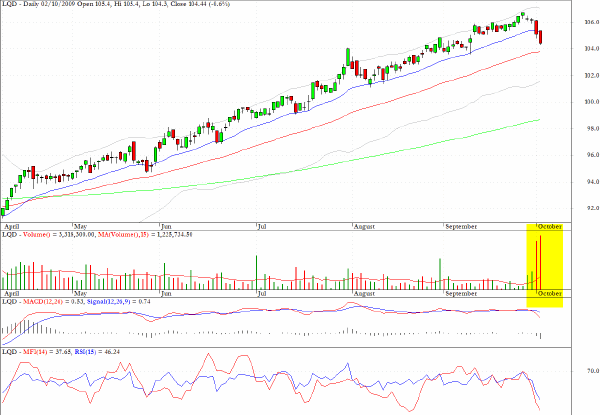
Large selling occurred in Thursday’s and Friday session for the exchange traded fund, LQD, which represents a cross section of high grade corporate bonds.
The very vigorous selling on Thursday adds further plausibility to the notion that major trading desks were able to trade ahead of the crowd on the pending weakness of the employment data.
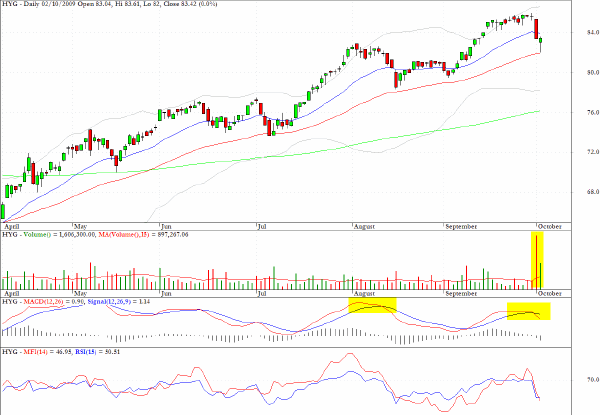
HYG, a sector fund which tracks high yield debt is also providing evidence of major distribution as the technicals appear to be rolling over. Notice also the massive volume which arose during Thursday’s trading.
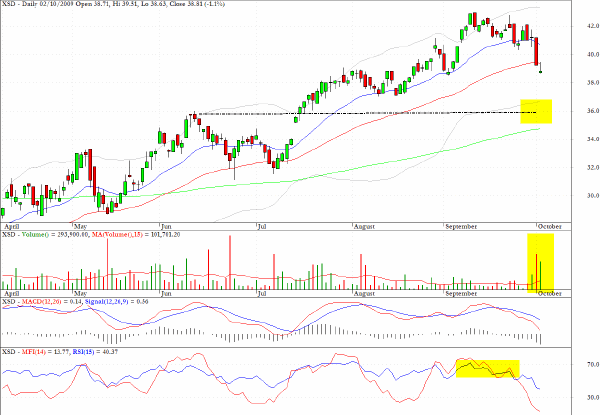
XSD, an exchange traded fund which tracks the semiconductor sector, has many technical divergences and also registered an Ichimoku bearish crossover following Friday’s session.
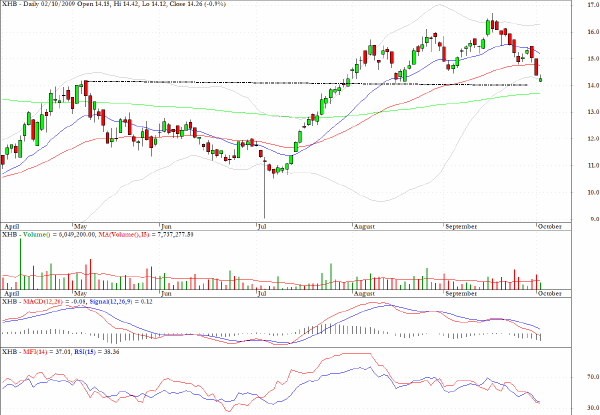
I shall repeat comments that I made in early September for the homebuilding sector, as available via the XHB fund, "there is a clear failure by momentum indicators to confirm the bullish price action in the second half of August."
The technical condition continues to deteriorate but there is some clear evidence of price support nearby at $14.
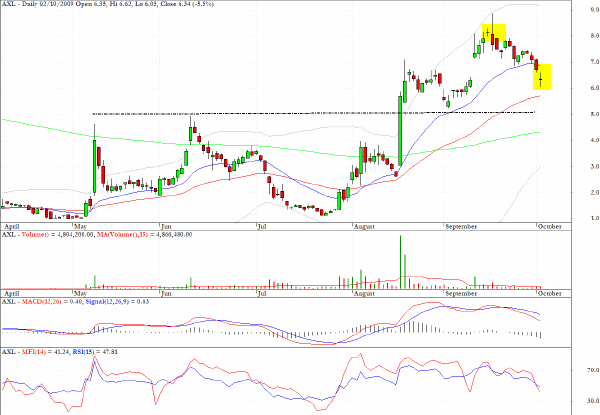
American Axle (AXL) registered a textbook example of a doji star formation in Friday’s trading and while the outlook is for lower prices there may be a short-term bounce potential, as with XHB, at the support line indicated on the chart.
Clive Corcoran is the publisher of TradeWithForm.com, which provides daily analysis and commentary on the US stock market.
|