| Corcoran Technical Trading Patterns For October 8 |
| By Clive Corcoran |
Published
10/7/2009
|
Stocks
|
Unrated
|
|
|
|
Corcoran Technical Trading Patterns For October 8
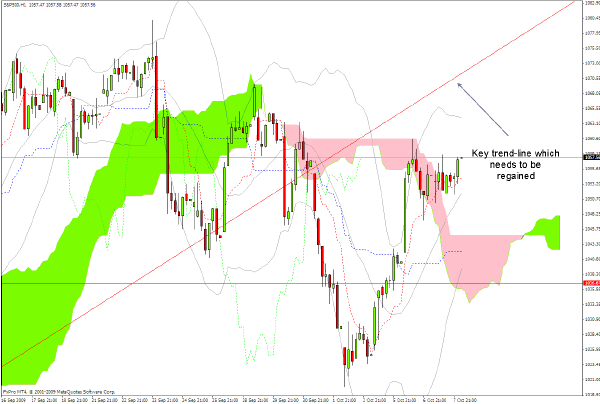
The hourly chart of the S&P 500 from yesterday shows that relatively little progress was made in terms of resolving the matter of whether the index can regain its footing above the diagonal trend-line (which tracks the lows since early September).
The fact that the index was also not able to pull away decisively from the cloud formation indicates that there is some lack of conviction that the market has the necessary momentum to tackle this hurdle at present.
In addition it suggests that traders may be having some difficulty in casting aside the doubts about direction that were inserted into the larger time frame analysis by last Thursday’s nasty sell-off.
There is still an underlying bias on the part of money managers to be buying the dips and the HFT algorithmic constituency is reinforcing that predisposition, but the overall lack of volume on the up days in contrast to the emergence of heavier volume on the down days is still a cause for some concern.
Perhaps the earnings season will bring some more convincing signs of genuine accumulation but for now the market has more of the tone and characteristics of short term distribution.
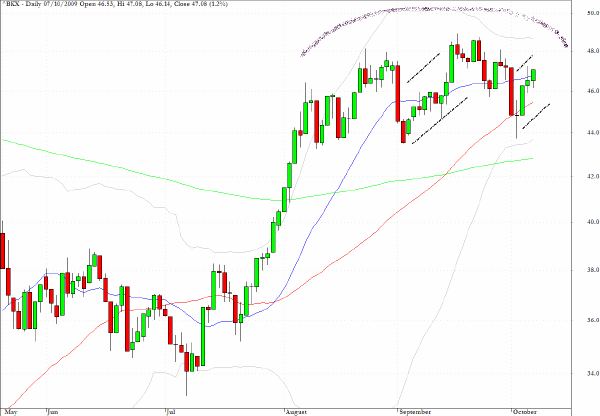
The KBW Banking Index (BKX) appears to be evolving a pattern which resembles the (eventually bearish) pullback pattern seen in September.
Technically the September pattern does not fit the requirements for a bear flag as the base of the flagpole was exceeded by the newer highs in the middle of the month but in other respects the long red candlesticks followed by pullback patterns is not what one really wants to see if you are of a bullish persuasion.
Also as illustrated there is a rolling dome to the pattern which would need to be penetrated soon by the most current pullback to alleviate the concern that the bears are starting to win the argument with respect to this index.
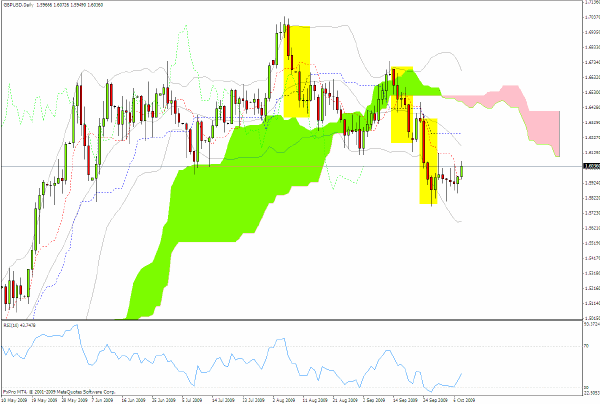
The GBP/USD daily chart shows, yet again, that the more decisive and impulse moves are largely red candlesticks and the present pattern looks suspiciously like a bear flag which would find stiff resistance in any renewed attempt to push above the cloud overhead.
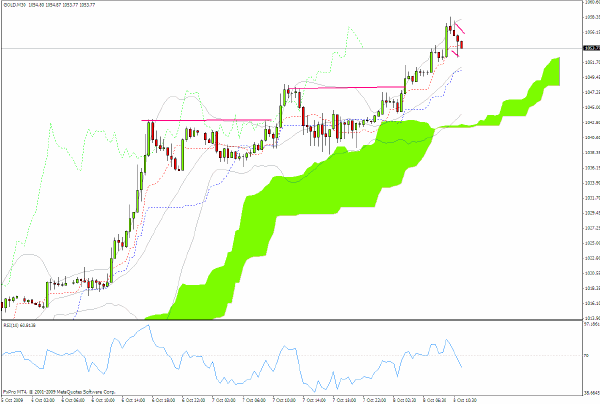
The 30-minute chart for gold on Thursday morning is revealing the same formations that I have been discussing all week. The RSI is beginning to suggest that a pause in the upward dynamics may be on the near-term horizon and a pullback to the 1040 level would not be at all surprising and also constructive.
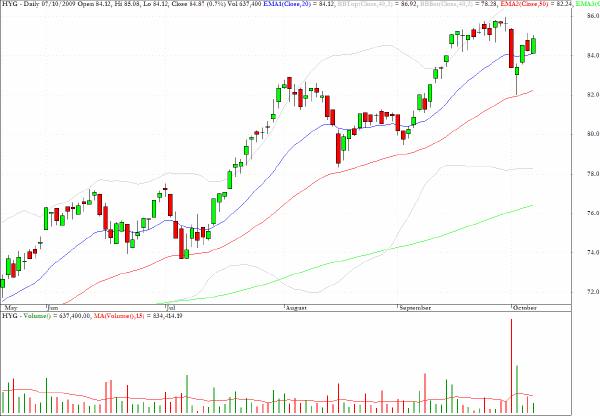
HYG, which tracks the high yield debt sector, and which took a battering last Thursday, still looks vulnerable to another selloff on the next occasion when the market gets spooked about an anemic recovery.
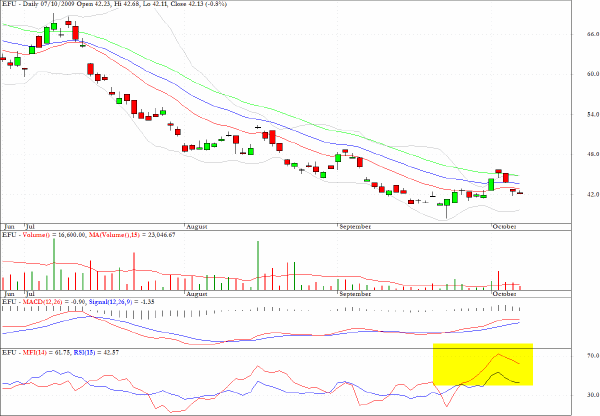
Although I do not often discuss the inverse ETF’s which track geographical sectors, there are some indications that money is moving into some of these funds, perhaps as a way of hedging or protecting recent gains for overseas markets, and especially the emerging economies.
EFU, which is an inverse tracker for the MSCI EAFE Index, shows quite notable positive divergences in the MFI chart segment.
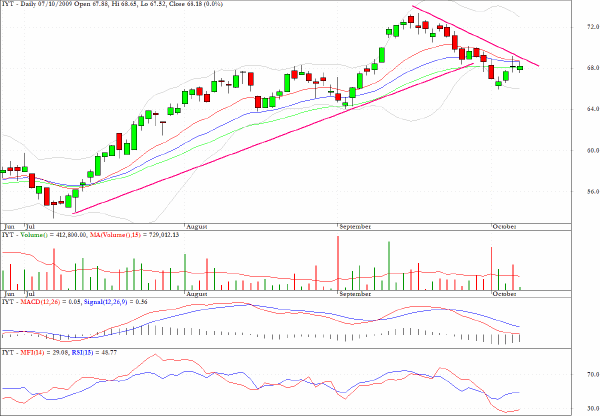
The chart for IYT, which tracks the performance of the Dow Jones Average Transportation index, is at a critical juncture. The short-term descending trend-line through recent highs has eclipsed the longer trend-line through the lows and notably the closing price from yesterday sits astride the intersection of all three major EMA’s which are tracked.
Clive Corcoran is the publisher of TradeWithForm.com, which provides daily analysis and commentary on the US stock market.
|