| Corcoran Technical Trading Patterns For October 9 |
| By Clive Corcoran |
Published
10/8/2009
|
Stocks
|
Unrated
|
|
|
|
Corcoran Technical Trading Patterns For October 9
In earlier commentaries this week the S&P 500 intraday charts have been reviewed to inspect whether the index could regain its position above the ascending trend-line through six-week lows which was violated last week.
So far this has not been attained although the resiliency of equities this week - after last week’s disappointing NFP report - suggests that the bulls still are getting their own way most of the time.
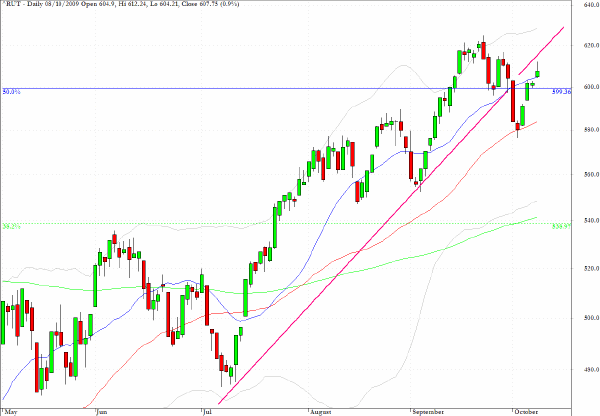
The daily chart for the Russell 2000 index (RUT) also reveals that a close above the 615 level - or just above yesterday’s intraday high - needs to be achieved soon to alleviate the concern that the mid-September levels do not represent an intermediate term peak.
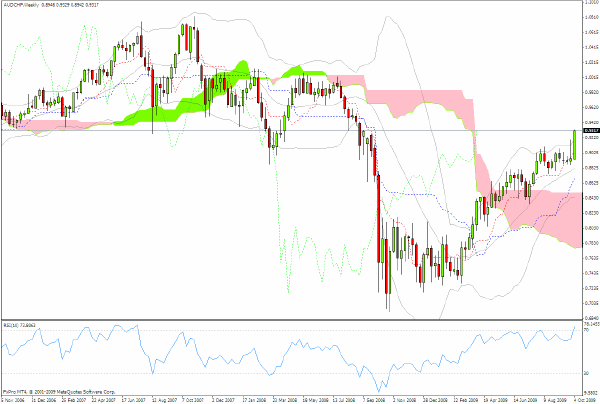
One of the currency pairs that is somewhat out of those followed by mainstream forex traders is the AUD/CHF pair which can be held up as an exemplification of the resurgent carry trade.
The weekly chart below shows that, owing to the strength of the Australian currency, the exchange rate has moved up to challenge an area of chart support/resistance which extends back more than two years.
The FX market at present is continuing to push the dollar lower on a relentless basis - and the likelihood of central bank intervention (already occurring from some Asian countries) - is increasing.
The AUD/CHF trade is not for the short term but for longer-term position players where the reward/risk ratio by selling the rate could be worthy of consideration.
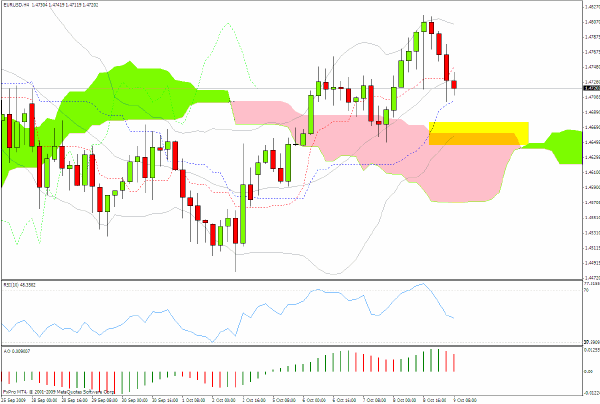
The EUR/USD is gradually moving towards the $1.50 level which has eluded it since last December.
The area highlighted on the 4-hour chart below which coincides with the top of the pink cloud could be a good place for entry into a short term intraday trade on the long side.
The thickness of the cloud below points, on this relatively longer-term time frame (from a forex perspective at least),that there is considerable buying support in the $1.46-$1.47 area.
The 30-Year Treasury bond auction conducted yesterday was considered lackluster with a lower bid to cover ratio than recent auctions and a move up in yield as the auction progressed.
The following news item from the New York Times also has the capacity to unsettle markets today:
Fissures are developing among policy makers at the Federal Reserve as they debate how and when to start raising the benchmark interest rate from its current level just above zero.
One hint of the discord came Tuesday, in a speech by Thomas M. Hoenig, president of the Federal Reserve Bank of Kansas City.
Though he stopped short of calling for immediate rate increases, Mr. Hoenig made it clear that he was getting impatient.
“My experience tells me that we will need to remove our very accommodative policy sooner rather than later,” he told an audience of business executives. ...
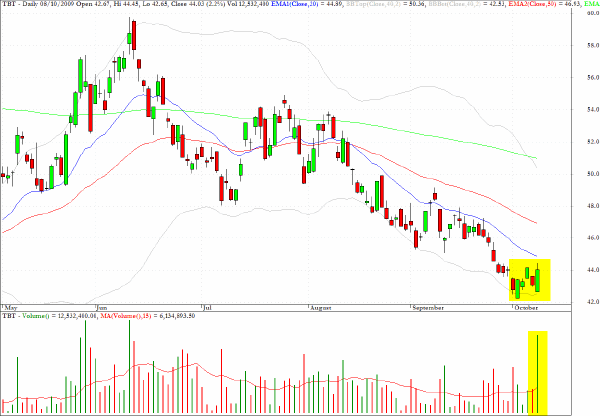
Notice also the very large volume spike on the TBT fund which represents a play on increasing yields at the long end of the Treasury spectrum.
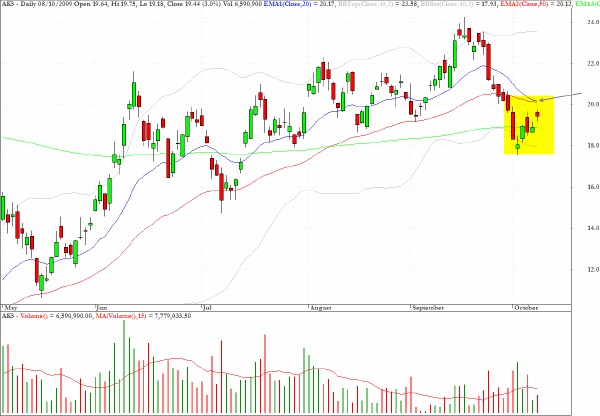
AK Steel Holding (AKS) faces a challenge to regain a foothold above the merged EMA’s as indicated by the arrow on the chart below.
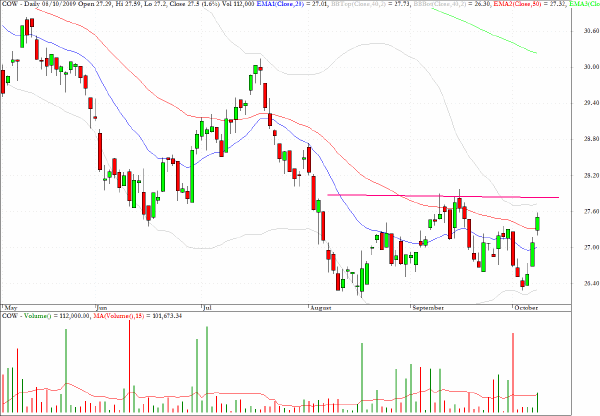
The exchange traded fund, COW, which tracks the livestock sector, could be preparing to emerge from an extended recovery process and even if the immediate outlook is uncertain the chart patterns suggest that, in the medium term, this could make further upside progress.
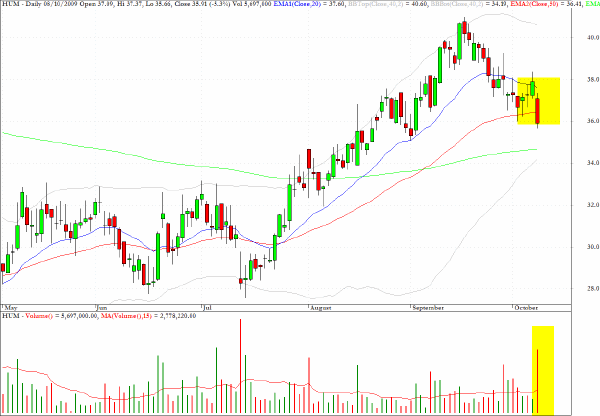
Humana (HUM) looks precariously balanced after dropping below the 50-day EMA yesterday.
Clive Corcoran is the publisher of TradeWithForm.com, which provides daily analysis and commentary on the US stock market.
|