| The McMillan Options Strategist Weekly |
| By Lawrence G. McMillan |
Published
10/8/2009
|
Options
|
Unrated
|
|
|
|
The McMillan Options Strategist Weekly
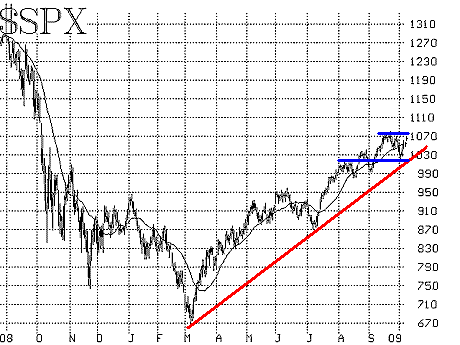
Last week's correction (60 $SPX points in a week and a half) had pushed $SPX down to 1020 or so. But, much as was the case a week ago, a strong Monday rally put life back into the bulls. Technically $SPX is in a trading range between 1020 and 1080. However, a close above 1070 would be constructive to the bullish case.

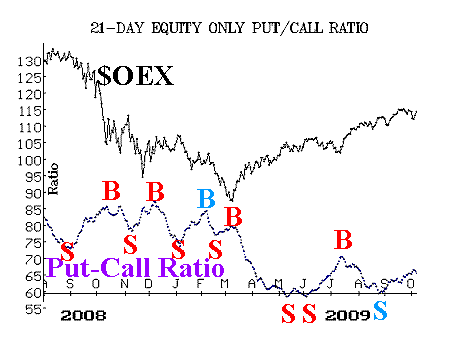
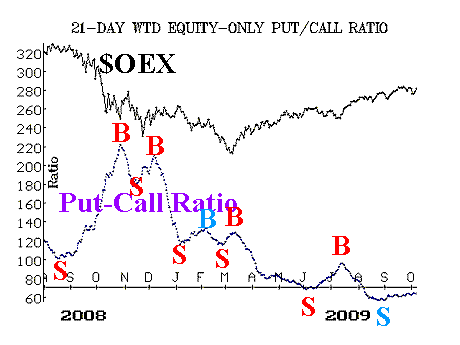
The equity-only put-call ratios remain on sell signals.

Market breadth suffered during the recent correction, to the point that breadth got oversold. The subsequent rally this week expanded breadth, generating a buy signal.

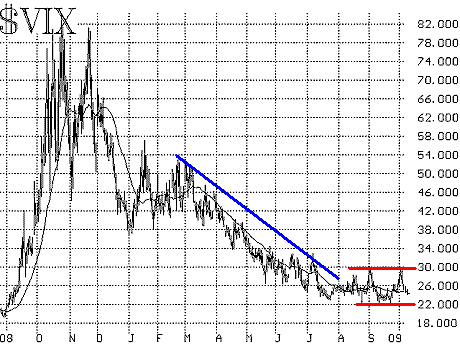
The volatility indices ($VIX and $VXO) rose during the market correction last week, but have not been able to follow through. As a result, there is "resistance" (if there even is such a thing on a volatility chart) at 30. $VIX was unable to rise above 30, and subsequently closed below 25. That completely negates the potential negatives of last week's rise in $VIX and once again puts these indicators in the bullish camp. From a longer-term perspective, Figure 4 shows that $VIX has been in a trading range ever since the steep downtrend in $VIX ended last August.

In summary, we continue to view the market as neutral to positive. An $SPX close above 1080 would be bullish confirmation, likely setting off another run to the upside -- perhaps to the next resistance area near 1120.
Lawrence G. McMillan is the author of two best selling books on options, including Options as a Strategic Investment, recognized as essential resources for any serious option trader's library.
|