| Corcoran Technical Trading Patterns For October 13 |
| By Clive Corcoran |
Published
10/13/2009
|
Stocks
|
Unrated
|
|
|
|
Corcoran Technical Trading Patterns For October 13
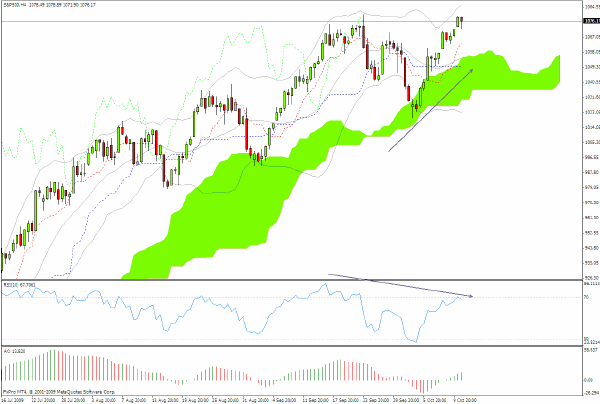
The four-hour chart is more traditionally used by foreign exchange traders but can also be useful for providing a slightly different perspective on equity indices.
The chart for the S&P 500 from yesterday, using this unorthodox time frame, clearly reveals what are signs of growing negative divergences from a momentum perspective.
This may not necessarily result in any serious pullback behavior as the market can drift sideways allowing the momentum divergence to reconfigure itself in a less problematic appearance.
The DJIA challenge of 10,000 looks on the cards for later this week and there should be major headlines in the popular press which (ironically) may be seen as the buying signal for many small investors who have been shunning stocks for the past two years.
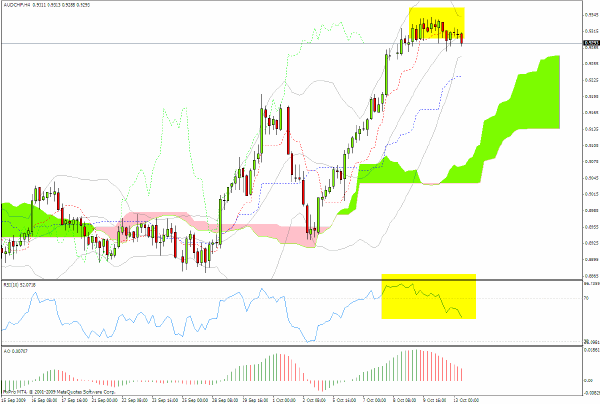
As discussed here last Friday, the AUD/CHF currency pair continues to astound but the constriction of the Bollinger bands is signaling that a major move lies ahead.
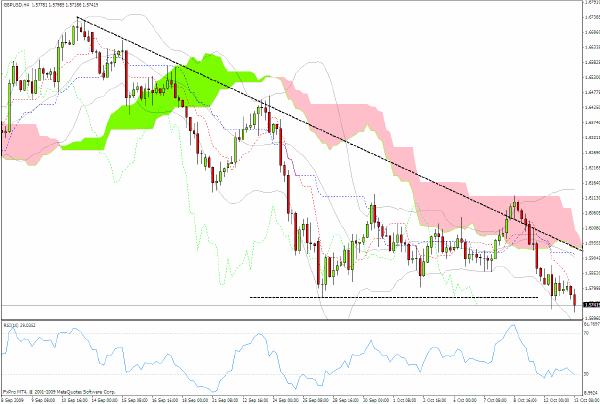
One of my favorite instruments to trade is the GBP/USD currency pair - and usually it is from the sell side.
Sterling is displaying a descending wedge pattern, and the last time it was as evident in multiple time frames was at the beginning of August 2008 whereupon it began its rapid descent.
It looks as though we are headed to the low $1.50’s again.
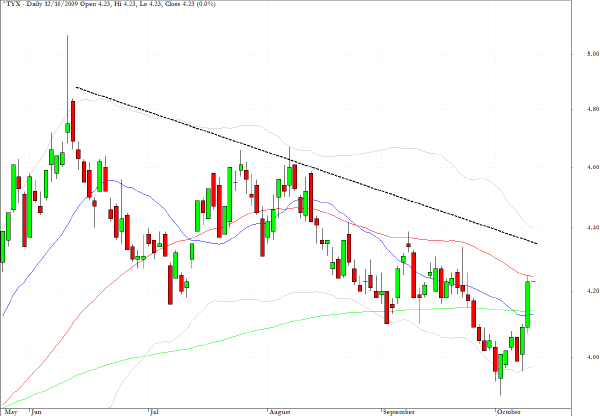
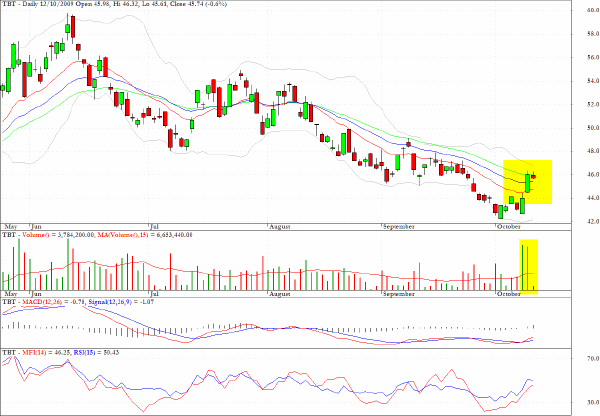
Last Friday I suggested the exchange traded fund, TBT, which tracks inversely the prices of long term Treasuries - or in other words it is a proxy for yields. The timing was good as Friday alone would have produced a four-percent-plus return off the opening price.
There was little volume yesterday due to the Columbus Day holiday but the action on the long bond as seen below suggests that the cash instrument could meet resistance from the 50-day EMA as well as the downtrend shown on the chart.
TBT will remain on the intermediate-term Watch List although after exiting on Friday’s close there may be no need to rush back in just yet.
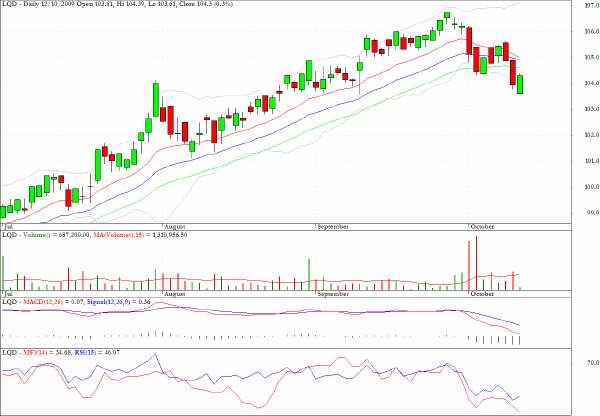
I mentioned a short recommendation for LQD, a fund which tracks investment grade corporate bonds, more than a week ago and the drop below all three moving averages and trendline support which is evident on the chart pattern suggests that monitoring for a pullback with eventual resumption of the downward move is likely.
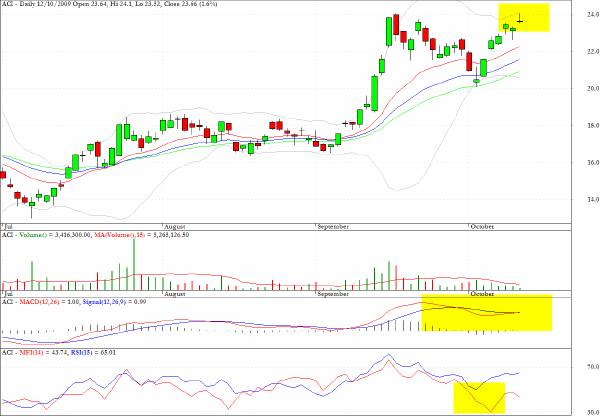
Arch Coal (ACI) registered a tiny gravestone doji star at a multi-period high and there are some other suggestions from the MACD and money flow chart that it may have touched an inflection point in yesterday’s session.
Clive Corcoran is the publisher of TradeWithForm.com, which provides daily analysis and commentary on the US stock market.
|