| Corcoran Technical Trading Patterns For October 14 |
| By Clive Corcoran |
Published
10/14/2009
|
Stocks
|
Unrated
|
|
|
|
Corcoran Technical Trading Patterns For October 14
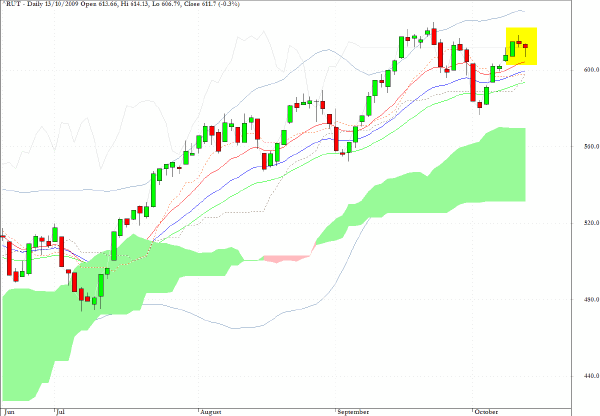
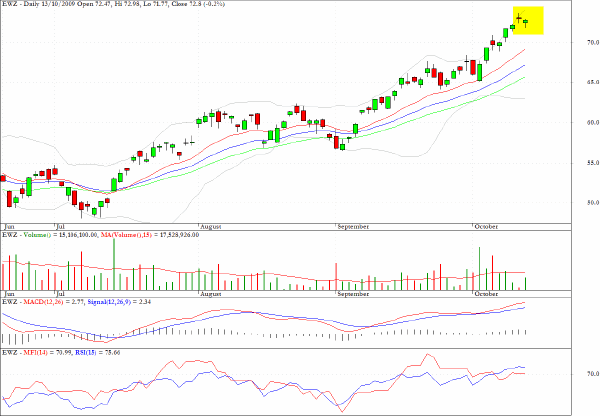
In scanning the charts this morning I was taken by how many - both ETF’s and individual stocks - are showing a pattern where there is a doji star/spinning top followed by a hanging man candlestick. According to traditional candlestick diagnosis this is not a constructive pattern for the long side, but in a market which just seems to want to go ever higher perhaps the rules have changed for interpreting these patterns!
The pattern is also evident on the chart below for the Russell 2000 Index (RUT)
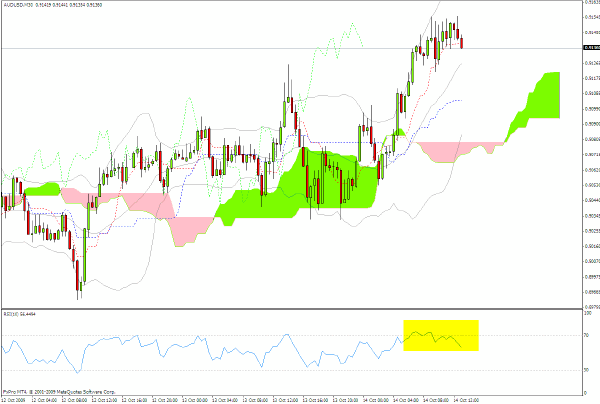
The AUD/CHF pair which I discussed yesterday produced a healthy intraday profit during yesterday’s trading but, as seems to be the case almost every time there is any corrective move by the Australian currency, more buyers rush in to propel it back to loftier levels.
I almost hesitate to point out the obvious which is the negative RSI divergence on the 30-minute chart for AUD/USD.
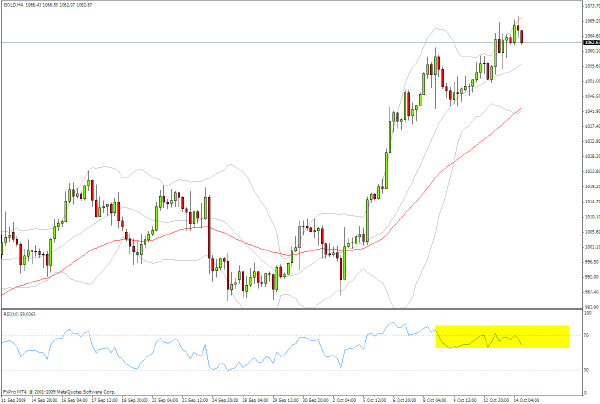
Also, gold is revealing some negative divergences. Anecdotally the price of gold for a sterling investor is now within a whisker of its highest value ever.
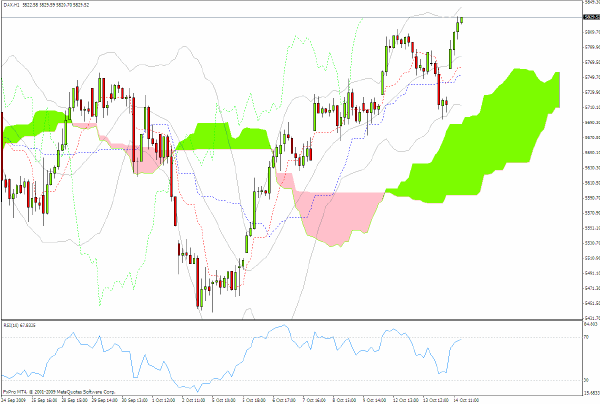
Germany’s DAX has broken to a new multi-period as this is being written but it would be prudent to follow the slope of recent RSI values during today’s session.
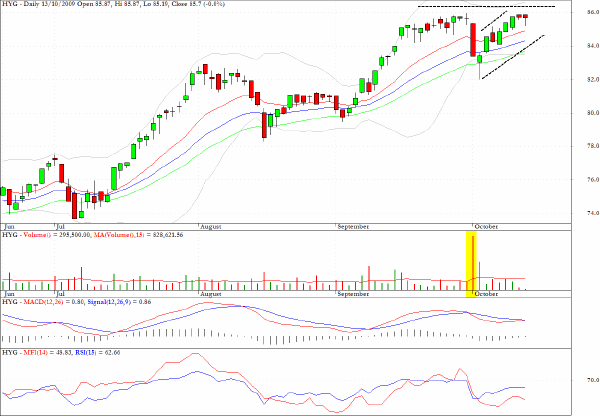
HYG, which tracks the high yield debt sector, and which took a battering on October 1 (the high volume session highlighted), may have reached the top of its pullback channel.
One more chart which has the doji star and hanging man pattern is for EWZ, the exchange traded fund which tracks the Brazilian market.
There is a rather stunning correlation between the AUD/JPY cross rate and the performance of the MSCI Emerging Markets Index, and according to a recent linear regression analysis based on a 40-day lookback, the correlation coefficient is approaching 0.8.
This reveals two things:
1. The carry trade is back in force
2. The new global equities index benchmark appears to be shifting from SPY to EEM.
Clive Corcoran is the publisher of TradeWithForm.com, which provides daily analysis and commentary on the US stock market.
|