| Corcoran Technical Trading Patterns For October 16 |
| By Clive Corcoran |
Published
10/16/2009
|
Stocks
|
Unrated
|
|
|
|
Corcoran Technical Trading Patterns For October 16
Amidst all of the attention that has been focused on the investment banks and the munificent benefits flowing to them from participating in the quantitative easing program, the other big story of the last few sessions has been the surge in oil prices. Needless to say, if oil prices continue up and beyond $80 per barrel this will be another fly in the ointment for Chairman Bernanke.
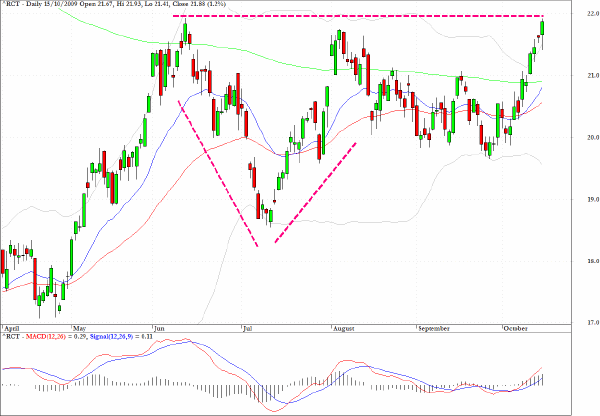
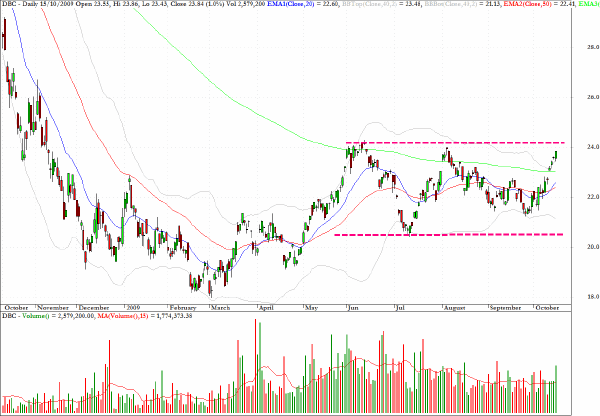
The chart below for the Rogers Commodity Index reveals a pattern which has some similarities to the one for gold which was reviewed here a couple of weeks ago just prior to its breakout.
The difference in the chart formation is that the head part of the inverted H&S pattern is not discernible but if the pattern morphs into more of a cup with handle pattern the potential for an upside breakout is similar.
It would be premature to diagnose this pattern at present, but we will be revisiting the chart during next week to see how the pattern is evolving.
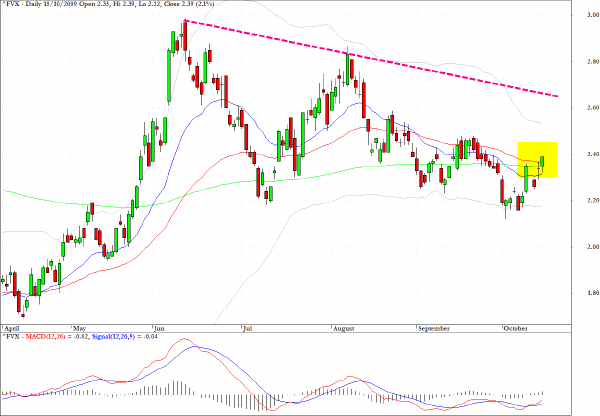
Yields on the five-year Treasury note moved above all three moving averages and a target level would be up towards the trend-line which has been drawn on the chart.
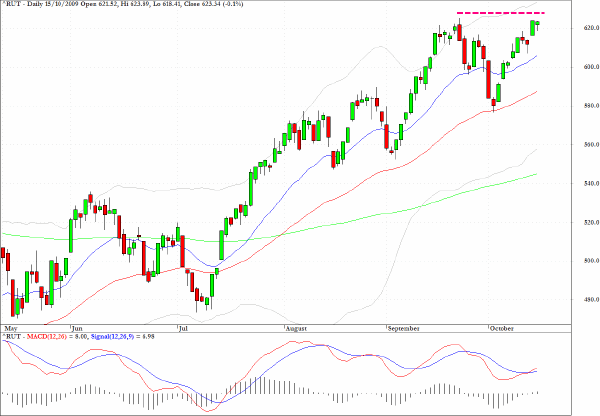
The high beta index, the Russell 2000 (RUT) could be stalling at current levels and notably has failed to make a comparable push this week to that which has been seen on the DJIA and S&P 500.
The index has certainly been very user friendly during the most lively part of the rally since July, but the high beta stocks are not the best place to be if, and when, a corrective episode arises.
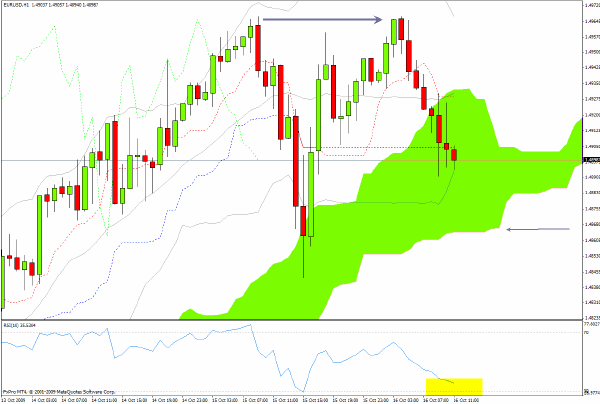
The forex market saw some lively action yesterday especially with UK sterling performing some rather spectacular moves against the euro. GBP/USD also came back from the brink of the descending wedge pattern discussed here but it has done that kind of thing before as well.
For now sterling is a little too exciting for my taste but the EUR/USD would be worth a look at on the long side if the currency retreats to the level indicated on the chart.
In accordance with the comments above regarding the commodity index, the exchange traded fund DBC, which has been range bound for several months, could be worth consideration if the pattern evolves as discussed.
In particular I would suggest monitoring the volume behavior, and notable in this regard was yesterday’s move up on 50% more than the average daily volume.
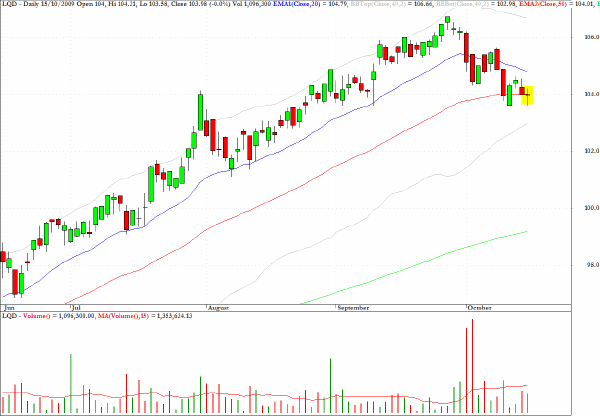
LQD, a fund which tracks investment grade corporate bonds, is one of several fixed income ETF’s to monitor and the tiny doji star straddling the 50-day EMA suggests that traders are having a hard time resolving the cross currents which provide clues as to near-term direction.
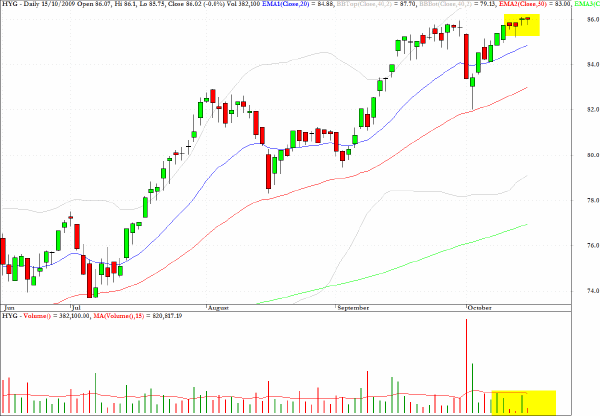
HYG, which tracks the high-yield debt sector, has reached a price plateau at the recent highs and the volume has dropped to minimal levels. I still see a bearish pullback pattern on this chart but recent price behavior in several equity related sectors has failed to deliver with this pattern.
I am still cautious on the short side, even though most equity sectors look very extended and therefore I am not punting much on the long side either. Sometimes it pays to just sit and wait until picture becomes clearer.
Clive Corcoran is the publisher of TradeWithForm.com, which provides daily analysis and commentary on the US stock market.
|