| Corcoran Technical Trading Patterns For October 19 |
| By Clive Corcoran |
Published
10/18/2009
|
Stocks
|
Unrated
|
|
|
|
Corcoran Technical Trading Patterns For October 19
Late last week I commented that the Russell 2000 was deviating somewhat from the larger cap indices in failing to make a new high despite the DJIA topping 10,000 and the S&P 500 moving up towards the 1100 level.
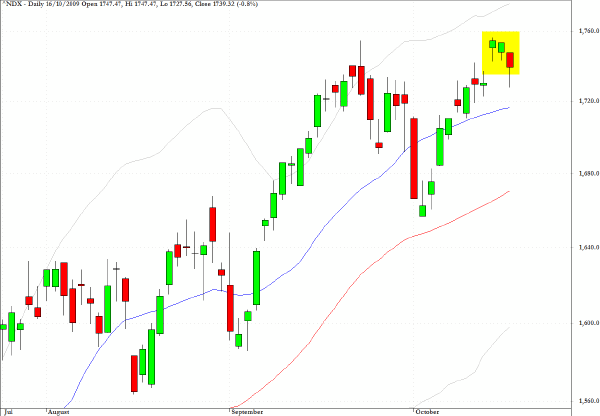
The Nasdaq 100 index (NDX), which represents a concentration of higher beta stocks than say its large cap counterparts in the S&P 500, should also be monitored this week for any suggestion that the large trading desks are looking more carefully at their high beta exposure which will, should there be a waning in the animal spirits, drop faster than the broader market does.
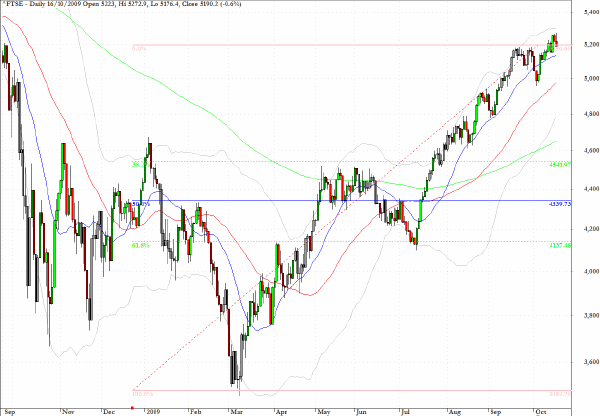
Back in late September, during a guest slot on CNBC’s European Closing Bell, I discussed the outlook for the FTSE 100 Index (FTSE). Essentially the point that I made was that 5200 represented an area of potentially strong resistance from a technical point of view. Subsequent market action would, I suggest, support that view.
The reasoning from a wave point of view can be laid out as follows.
From the March low at 3460 the index moved up 1060 points to the 4520 level in May where it hit the first corrective wave bringing it back down to 4140. Adding back the same length of wave to the third wave which we still appear to be in gives a target of 5200 almost exactly. There was some pullback from the 5200 level in early October but if the third wave is still intact there is a possibility that we could be looking at a 1.168 target on its length which would put us closer to the 5800 level.
My slight discomfort with this notion, and without resorting to explanations involving more complex EWT structures, is to suggest that the customary robust and strident personality of a third wave needs to assert itself soon or the possibility of a fourth and corrective wave is increasing.
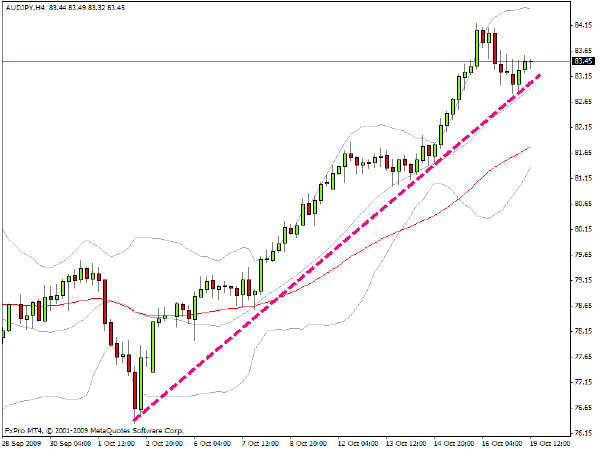
The ascent of AUD/JPY since early October on the 4-hour chart is quite remarkable. There were some wobbles during last week’s trading and this week I shall be watching for evidence that there could be some waning of momentum as traders attempt to surpass the recent 84.20 top.
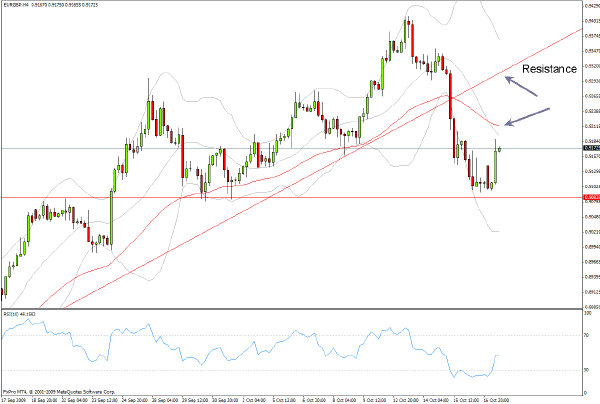
Sterling, which is always one of the more lively instruments in the sandbox, faces resistance at the two levels indicated on the chart as it attempts to defend itself against the naysayers who want to see parity with the eurozone currency.
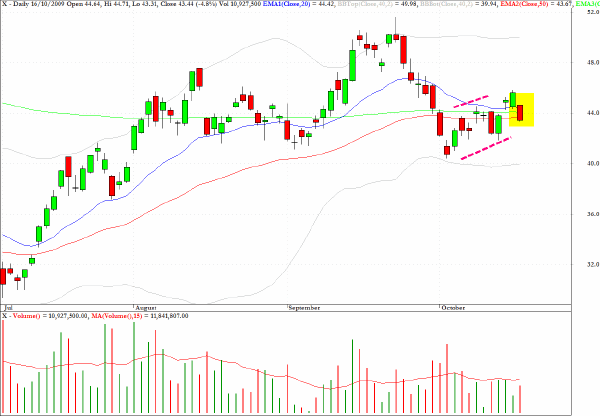
US Steel (X) appears to be vulnerable and SLX the chart for the steel sector should also be watched during this week’s trading.
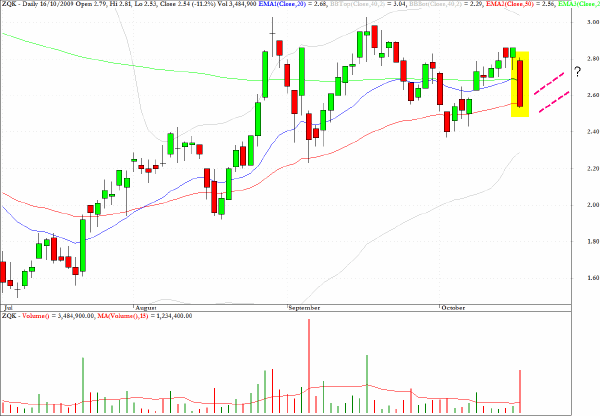
Quicksilver (ZQK) reveals a rather nasty red trend day from Friday. Interestingly there is supportive back testing data which shows that following such a decisive uni-directional move down to a support level a bounce has a high probability. This could present a quick recovery trade for those willing to take a short-term opportunistic view, despite the evidence that longer term the most likely direction is down.
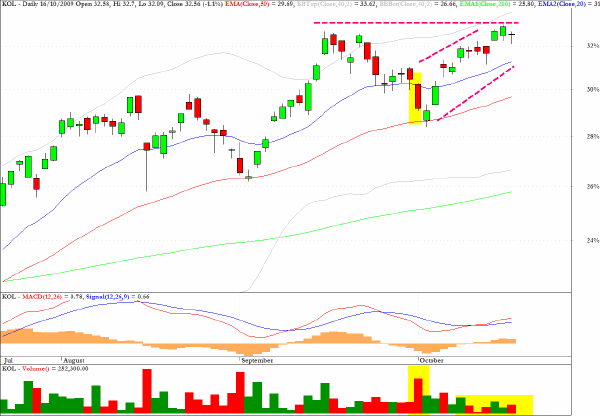
Another basic industrial sector as represented by the KOL fund, is also revealing some divergences within a pullback channel.
Clive Corcoran is the publisher of TradeWithForm.com, which provides daily analysis and commentary on the US stock market.
|