| Corcoran Technical Trading Patterns For October 23 |
| By Clive Corcoran |
Published
10/23/2009
|
Stocks
|
Unrated
|
|
|
|
Corcoran Technical Trading Patterns For October 23
Yesterday’s recovery affirms my view that, despite the growing prospects for a significant correction, trading desks are still having too easy a task in squeezing the overly anxious short sellers who seem to have a fetish for wanting to call the exact top.
There are several fairly obvious divergences developing, not only for equity indices but also within other asset classes, and yet the prevailing objectives of the major funds is to tap into abundant liquidity at virtually zero rates of interest, exploit the carry trade and keep asset prices moving higher.
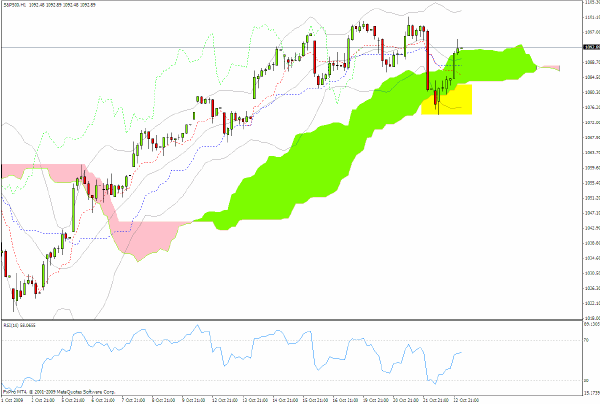
The hourly chart for the S&P 500 shows how the potential penetration below the Ichimoku green cloud posed the clear risk of a rather severe technical break in early trading yesterday, and that those who mounted the heroic rescue efforts will now have to sustain the extraordinary efforts today to improve the momentum profile for the weekly close.
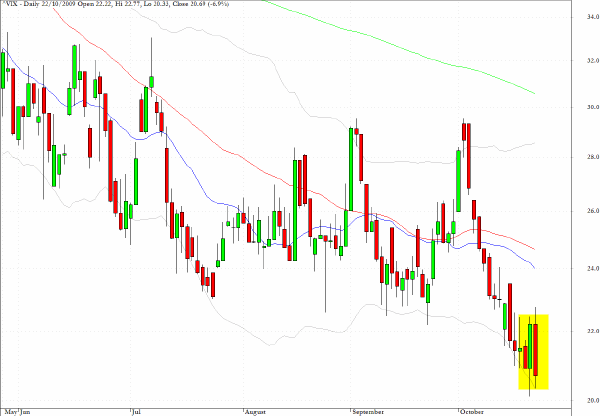
Many charts are revealing upticks in the intraday average true range readings and the VIX is reflecting the heightening of implied volatility by registering large body candlesticks.
Notably, despite the recovery yesterday, the VIX was unable to reach back to the intraday low seen in Wednesday’s session.
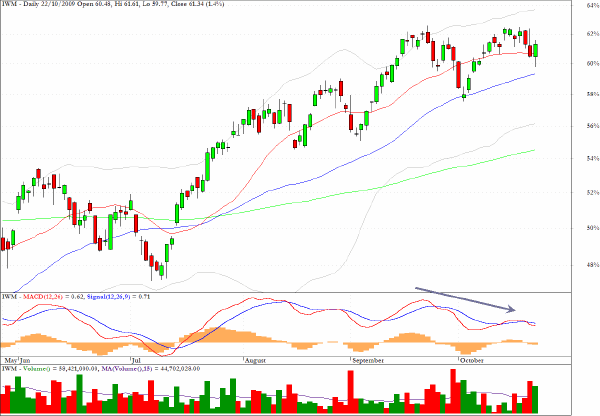
The exchange-traded proxy for the Russell 2000, IWM, is one of several indicators which I use to monitor macro themes and I shall simply reiterate my concern that the action in recent days seems to have gravitated away from the high beta universe of stocks towards the large cap and strategic DJIA stocks where index levels are currently being monitored very closely in the mainstream media.
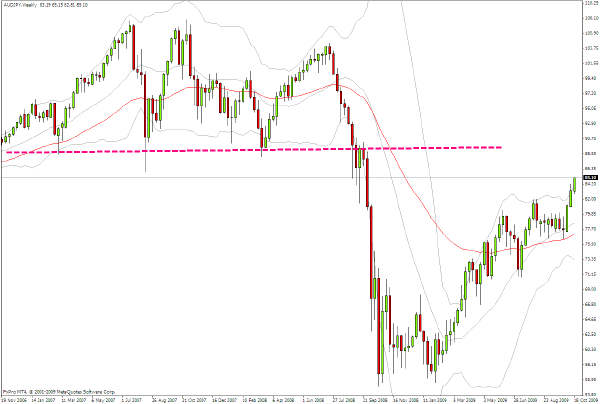
Taking a long-term perspective on one of the currency pairs which I track closely, AUD/JPY, the rate is now entering a zone where the long-term line of support/resistance drawn on the chart will act as an attractor to daily price action, but where the risks of an upward trend exhaustion are increasing.
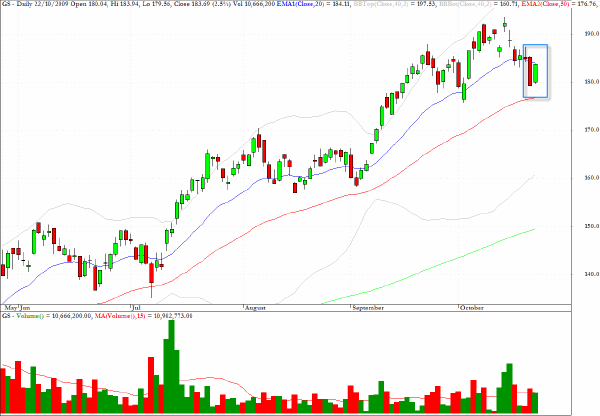
Goldman Sachs (GS) has registered back-to-back trend days - one red and one green - and notably yesterday’s was an inside pattern suggesting that there is some directional uncertainty present for this barometer stock.
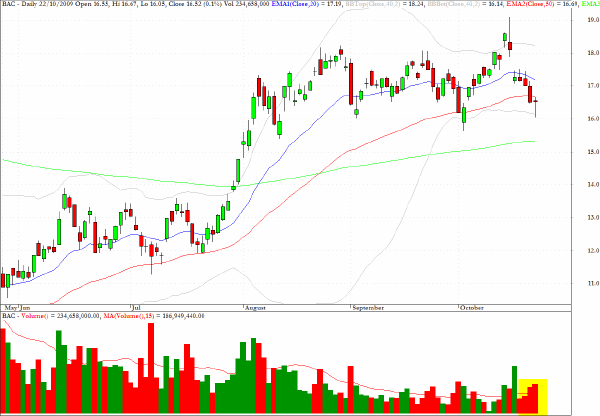
Bank of America (BAC) is struggling and as illustrated by the price and volume chart the bank was not able to make progress even with the overall market rally yesterday.
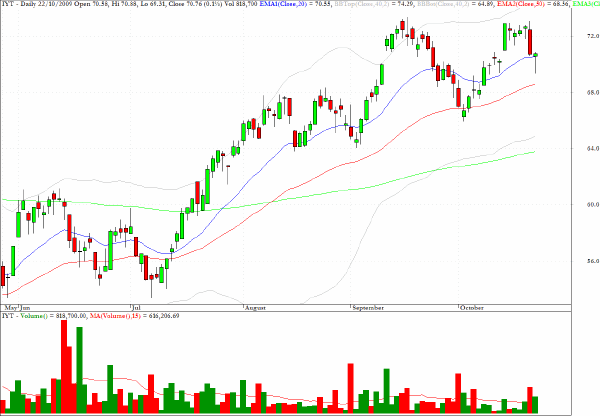
The chart for IYT, which tracks the performance of the Dow Jones Average Transportation index, shows a possible double top pattern with a slightly lower high in mid-October and it would seem that a more thorough testing of the $65 level needs to be made in coming sessions.
Clive Corcoran is the publisher of TradeWithForm.com, which provides daily analysis and commentary on the US stock market.
|