| The McMillan Options Strategist Weekly |
| By Lawrence G. McMillan |
Published
10/23/2009
|
Options
|
Unrated
|
|
|
|
The McMillan Options Strategist Weekly
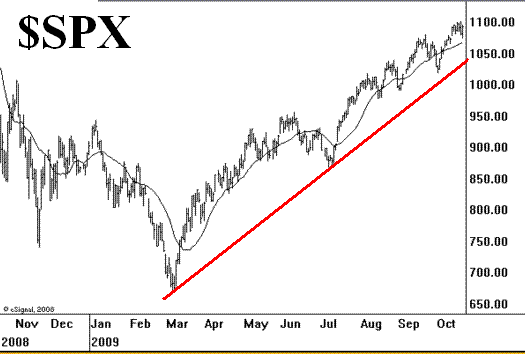
The broad market rally continued early this week, with many broad-based indices and stocks making new 52-week highs. However, the Obama administration's latest and boldest attempt to date at outright socialism (or worse) caused a very negative reaction in the stock market on Wednesday, and SPX dropped 20 points in less than an hour. The selling persisted Thursday (today), and $SPX fell through support at 1080, eventually bottoming at 1074. But then buyers reappeared, and the uptrend was reaffirmed as $SPX traded 20 points higher. The $SPX chart thus has support at 1075- 1080. Furthermore, there is support in the 1050-1060 area, where the rising trend line connecting the March and July lows resides, as does the 20-day moving average. A clear violation on the downside of that lower support would be very negative.

The possibility of further weak breadth causing another sell signal still exists. After the last breadth sell signal, $SPX fell another 40 points in a week.

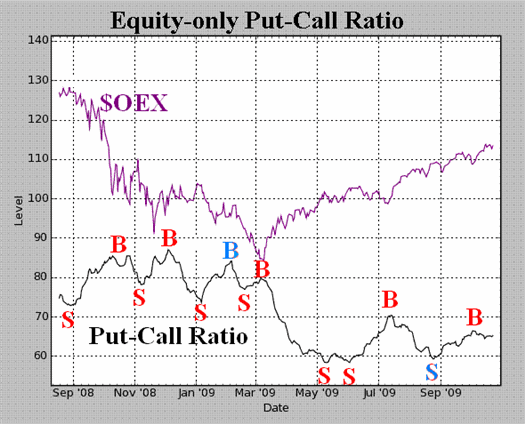
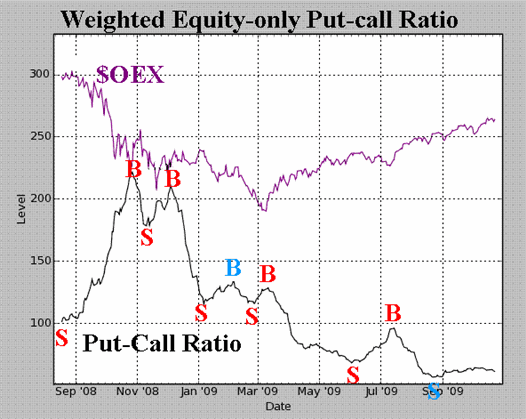
Equity-only put-call ratios are still beset by the distortions of the heavy hedging activity we've seen lately. Thus we are not relying on them for directional signals at this time.

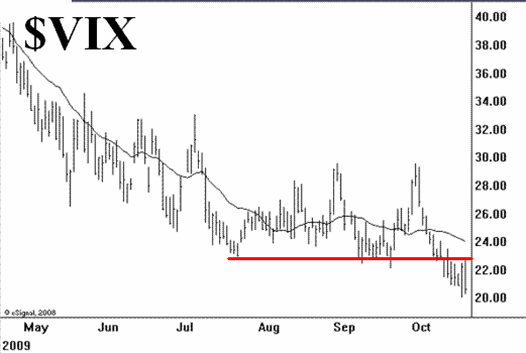
Volatility indices made new lows for the year several times this week, including today, despite reversing sharply upward in the last hour on Wednesday. The $VIX chart is still downward-sloping. There is "resistance" (if there even is such a thing on a volatility chart) at 23, and the 20-day moving average is at 24. So $VIX would have to exceed both of those before one could even begin to entertain thoughts of an uptrend in $VIX. As a result, the $VIX chart remains bullish for stocks.

So we remain cautiously bullish at this point, remaining mindful of the fact that a violation of the $SPX uptrend and/or the establishment of a $VIX uptrend would likely cause us to turn bearish.
Lawrence G. McMillan is the author of two best selling books on options, including Options as a Strategic Investment, recognized as essential resources for any serious option trader's library.
|