| Corcoran Technical Trading Patterns For October 26 |
| By Clive Corcoran |
Published
10/25/2009
|
Stocks
|
Unrated
|
|
|
|
Corcoran Technical Trading Patterns For October 26
Friday’s action in the US session raises some interesting dilemmas for the bulls.
On the one hand, there is still much evidence that funds are enamoured with the carry trade, the emerging markets and commodity-related stocks as evidenced by supportive technical conditions in the ETF’s for those geographical and specialty sectors. On the other hand, there are more signs that for US-based investors the domestic market is sending some clear warning signals.
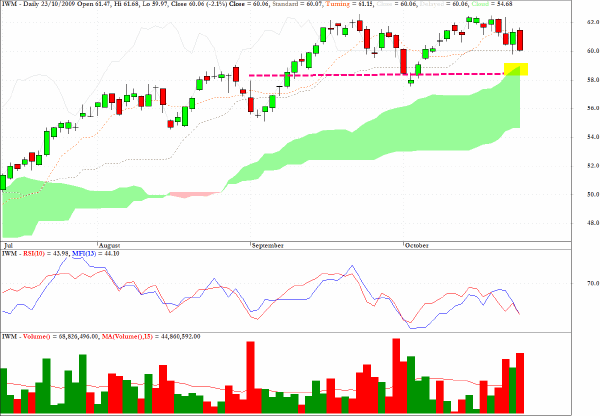
Two indices that I have focused on in the last two weeks are registering some cause for concern - the Russell 2000 and the DJ Transports. Both are displaying more evidence of rolling top formations.
Below is the IWM chart which can act as a surrogate for the Russell 2000 and for the first time since July this instrument is showing a clear movement towards the Ichimoku cloud formation, and at the same time this is also associated with poor signals from the RSI and MFI readings.
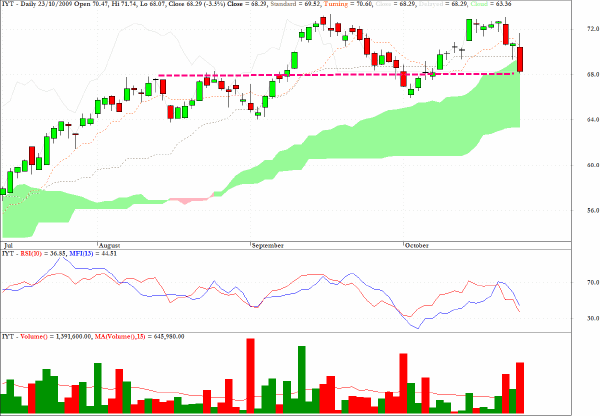
The IYT sector fund is a proxy for the DJ Transportation stocks and the story is similar to the one for IWM.
The prospect of more dissonance between the behavior of largely US based high beta and transportation stocks and the large DJIA blue chips coupled with the still healthy appetite for exposure to emerging markets reflects a market environment which is, to use an overworked expression, uncharted.
At the Tradewithform website one of the pattern templates which tracks the degree to which certain stocks are registering divergences which often indicate short covering candidates, produced a large number of signals following last Friday’s session.
In an anxious market there is both a high propensity for the bears to run for cover on sudden bursts of enthusiastic buying, as well as for signs of technical weakness to make fund managers holding long positions consider converting some of their market exposure back into cash.
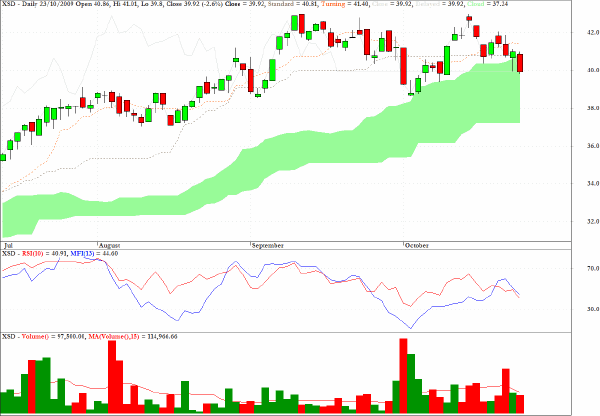
Yet another sector fund which is not acting well from a technical point of view is XSD, representing semiconductor stocks and mentioned here recently. Once again it has entered the Ichimoku cloud pattern for the first time since July and the volume chart indicates that the larger volume spikes are associated with the red candlesticks rather than the green ones.
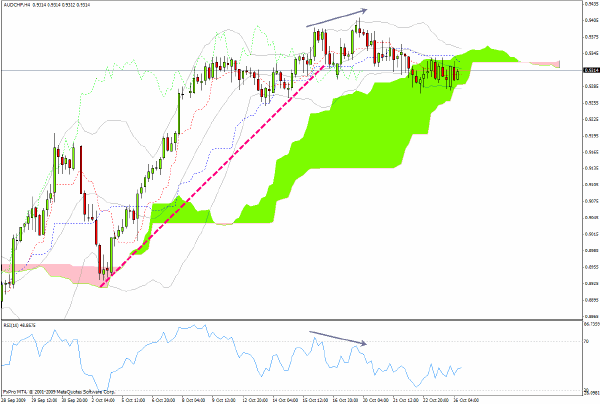
In addition to the evidence of rolling top patterns in some key US indices, there is also need to pay some attention to some of the less widely followed currency pairs within the carry trade. Periodic checks on the AUD/CHF pair would be well-advised this week.
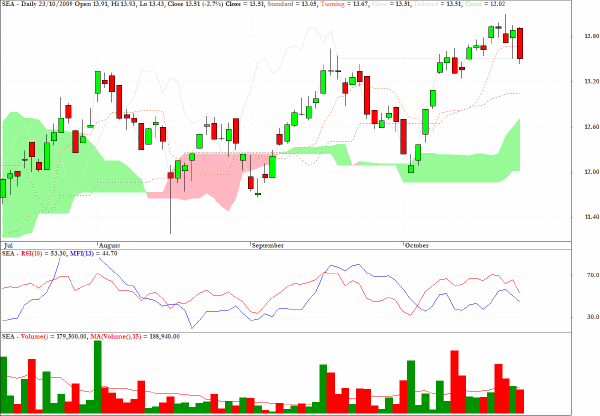
Continuing with the schism already touched on i.e. between growing caution about the US economy coupled with an underlying belief in the global recovery story and a passing of the baton from the US to the emerging markets, the sector fund SEA which represents a bet on recovery of international trade, could also present an opportunity on the long side at the $13.20 level.
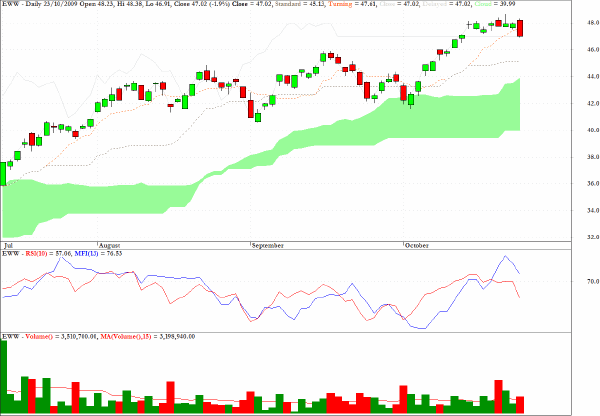
EWW, an exchange traded fund which tracks Mexican equities, is one of the funds, alluded to in my remarks above, where a bout of short covering would not be surprising.
Clive Corcoran is the publisher of TradeWithForm.com, which provides daily analysis and commentary on the US stock market.
|