| Corcoran Technical Trading Patterns For October 27 |
| By Clive Corcoran |
Published
10/26/2009
|
Stocks
|
Unrated
|
|
|
|
Corcoran Technical Trading Patterns For October 27
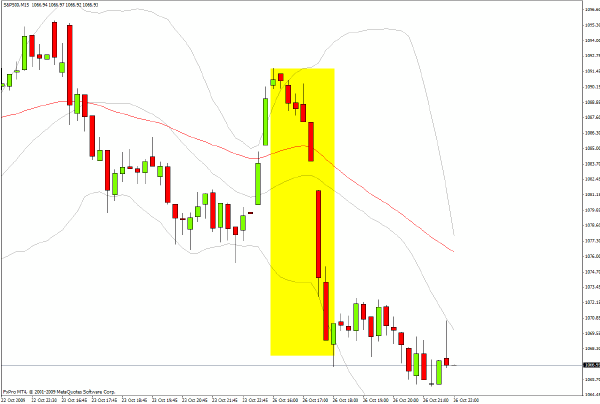
The divergences to which I alluded in yesterday’s commentary - primarily involving the US equity market - caused an anxious market to sell off rather abruptly in the early going. While those more persuaded of the need to find a fundamental or news related item to explain such market movements were attributing the drop to bank downgrades and intervention in the forex market, the growing technical divergences have been evident for all to see for some time.
Although I did not see Nouriel Roubini’s appearance on CNBC’s Squawk Box, I did catch some of the edited clips and I think he spelled out well the precarious nature of the "mother of all carry trades" theme.
As Roubini suggested, the irony that equity traders now face is that the worst development for global equities would be a strong dollar.
The intraday chart for the S&P 500 highlights the selloff which must have sowed some seeds of doubt for some of those propagating the Panglossian spin on recent macro-economic/financial developments. The possibility of a repeat performance of the July 2007 abrupt unwind in the carry trade might induce them to re-examine their cornerstone premises if the US dollar no longer cooperates by dropping every day.
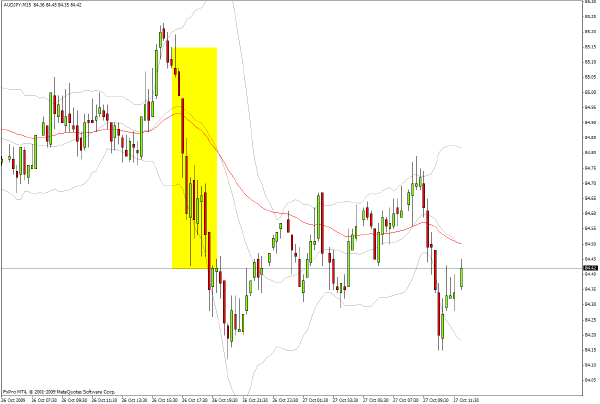
Sometimes a picture is worth a thousand words and that applies to the carry trade phenomenon. Several readers of this column have asked about the carry trade and why it is becoming an increasing part of my focus and the chart below may help to throw light on the matter.
Incidentally the course which I shall be presenting in London in late November in conjunction with Thomson/Reuters (details are available at the link at the top of this commentary) will include an in-depth look at the influence of the carry trade on global capital movements and asset allocation.
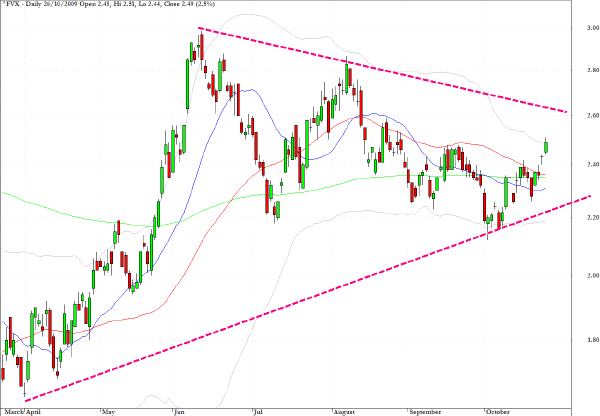
Another factor behind the "unusual" movements in the markets yesterday, highlighted by a resurrection (even if it may be short-lived) of the US dollar, was the move up in yields across the entire Treasury spectrum.
As discussed here a week or so ago the five year maturity may be the best to monitor as it moves further into a pronounced triangular formation.
A surprise break out to the upside on yields, which might be a requirement for the pressure now being put on the US administration by those holding trillions denominated in the global reserve currency, would apart from strengthening the dollar also not be favorable to US banks operating their own more domestic version of the carry trade - i.e. riding the yield curve.
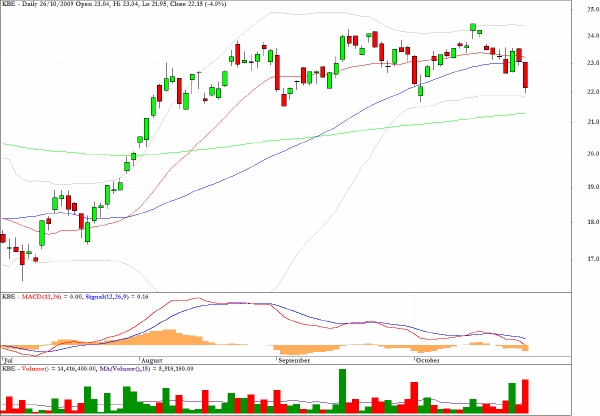
The KBW Banking Index (BKX) is living somewhat dangerously and as the trend lines drawn suggest it is quite vital that it finds support near current levels.
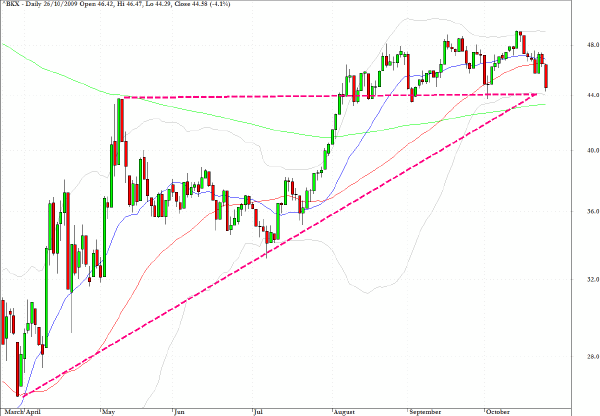
As previously discussed in relation to the KBW Banking Index, one would expect the current price area to offer some support, and the exchange traded fund, KBE, provides a vehicle for an immediate term opportunity on the long side.
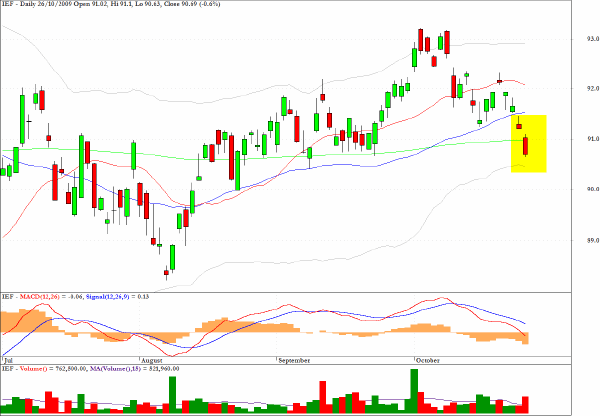
IEF, is a fund offering from iShares, which tracks the price on the 7-10 year section of the US Treasury yield curve and thus moves inversely to yield. The fund dropped below its 200-day EMA level yesterday on increased volume.
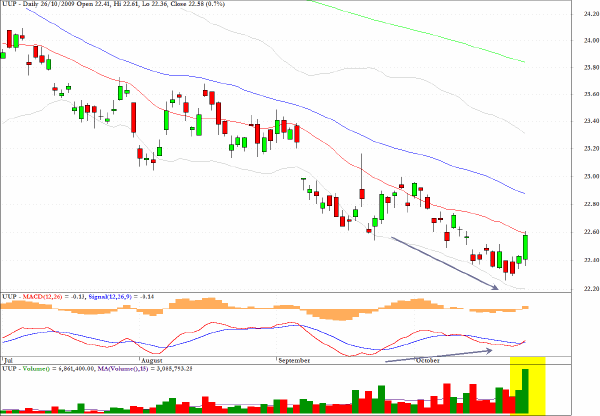
The exchange traded fund which represents a play on the upside possibilities for the US dollar index, UUP, is revealing some positive technical divergences. But having said that it has been doing so for several weeks and still seems to have the buoyancy of a lead balloon.
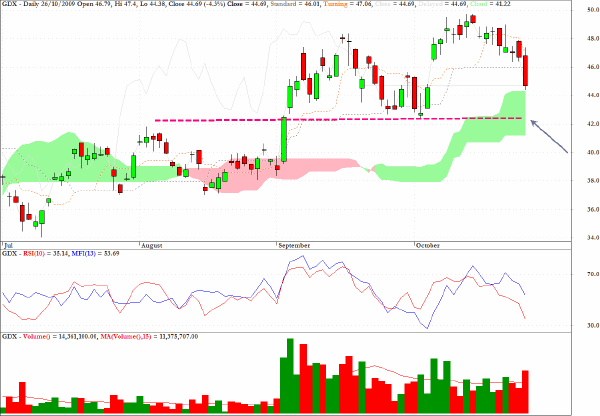
GDX, which tracks the gold mining sector, is approaching a price zone where the long side would be worthy of consideration.
Clive Corcoran is the publisher of TradeWithForm.com, which provides daily analysis and commentary on the US stock market.
|