| Corcoran Technical Trading Patterns For October 28 |
| By Clive Corcoran |
Published
10/27/2009
|
Stocks
|
Unrated
|
|
|
|
Corcoran Technical Trading Patterns For October 28
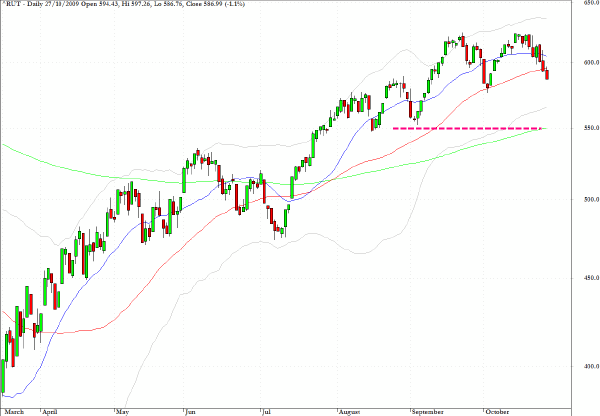
There are signs that the carry trade unwind is creating some seismic foreshocks. The Russell 2000 (RUT) acted as the canary in the coal mine over the last few weeks and sent a clear message that the high beta stocks were not the place to be as the prospects of a correction began to gather momentum.
The target on the chart below of 550 would suggest that the correction would be in the order of about ten percent from the recent highs. However, there is a plausible case being promoted by some EWT advocates that a corrective wave C might be rearing its ugly head. If the latter is the case, and it seems a little premature to be calling that in my humble opinion, then the outlook for equities, over the longer term, most definitely is not rosy.
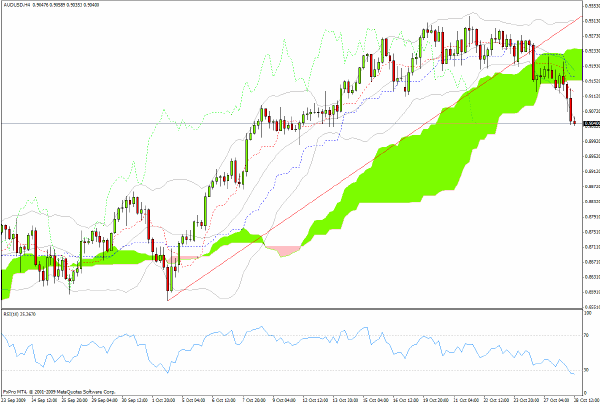
Some readers may have wondered why the Australian dollar has featured prominently in this column over the last few weeks. My suggestion is that the rolling over of the carry trade pairs, AUD/USD and AUD/JPY in particular, could be pointing to a turn of the tide with the implicit message that the easy money that has been made this summer within the emerging markets and commodities could be drawing to a close.
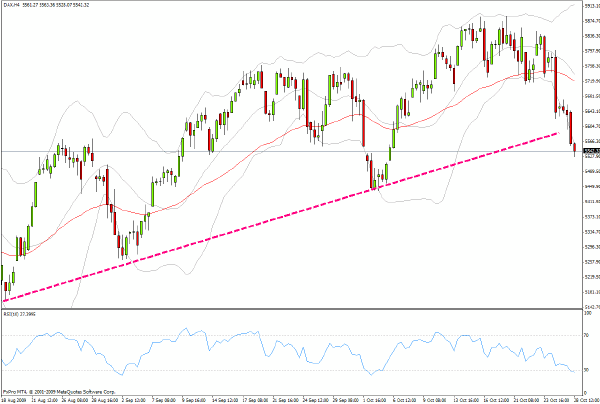
The main motif on many charts is the breaking of some reasonably prominent trend lines. The 4-hour chart of Germany’s DAX as of Wednesday morning trading reveals just such a break, and reviewing potential levels of support, it is not difficult to once again - as with the diagnosis of the Russell 2000 chart - see the capacity for a 10% correction from the mid-October highs.
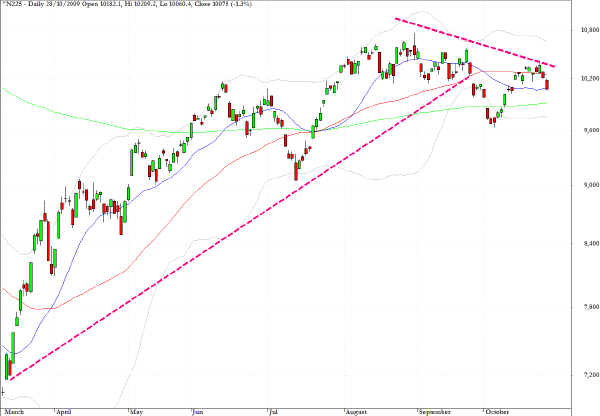
The Nikkei 225 (N225) put in a valiant effort to regain its foothold above the breakdown level alluded to here a couple of weeks ago, but with strengthening of the yen, the near-term outlook is for a retreat towards a retesting of the early October lows near 9200.
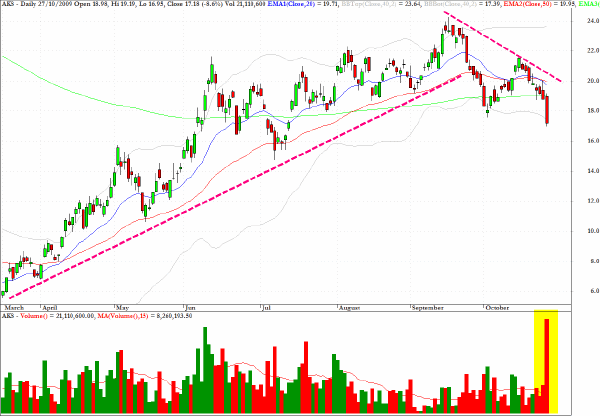
AK Steel Holding (AKS), also mentioned here about two weeks ago as looking vulnerable, was also very weak in the steel sector.
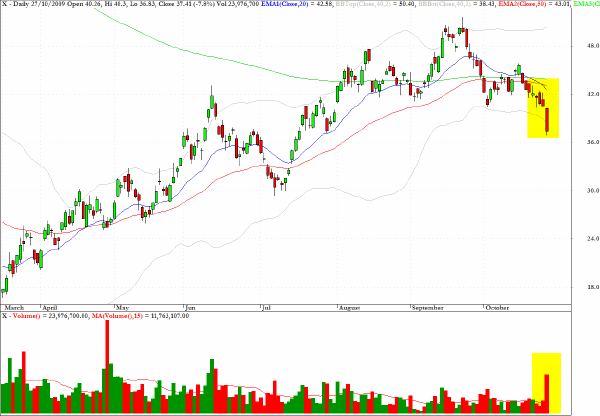
US Steel (X), which was mentioned here last week, was a notable casualty in yesterday’s selloff on very substantial volume and there is no obvious level of chart support for some considerable distance.
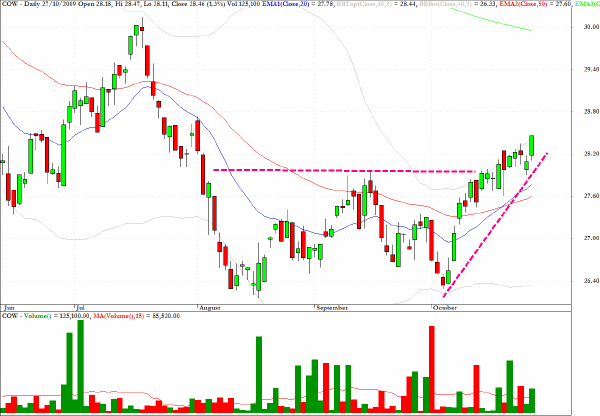
Here are comments regarding one of the long selections made here this month.
The exchange traded fund, COW, which tracks the livestock sector, could be preparing to emerge from an extended recovery process and even if the immediate outlook is uncertain the chart patterns suggest that, in the medium term, this could make further upside progress.
Clive Corcoran is the publisher of TradeWithForm.com, which provides daily analysis and commentary on the US stock market.
|