| Corcoran Technical Trading Patterns For October 29 |
| By Clive Corcoran |
Published
10/28/2009
|
Stocks
|
Unrated
|
|
|
|
Corcoran Technical Trading Patterns For October 29
Scanning charts this morning I was taken by the number of key trend lines which have been violated in the most recent selloff.
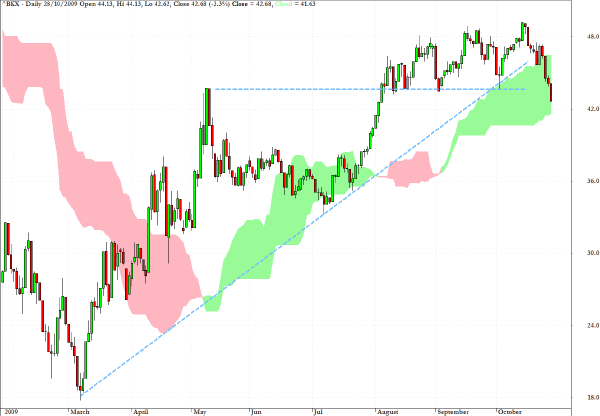
The KBW Banking Index (BKX) is one of the most troubling and I have simplified the charts today (partly so that they reproduce more clearly when I appear on CNBC’s European Closing Bell this afternoon) to show the basic violations and the critical possibility that what is still, at present, an expected correction, could potentially give way to a much more serious breakdown. Should the selling continue, liquidity issues may re-present themselves as many hedge funds and trading desks all try to head for the same exits at the same time.
As can be seen, the bottom of the green cloud on the right hand side of the chart - which is not much more than 2% below yesterday’s close - could potentially provide support in coming sessions. If this breaks, the next chart level where there is price support would not be until around 36 which would make the extent of the correction from the recent top something approaching 25%.

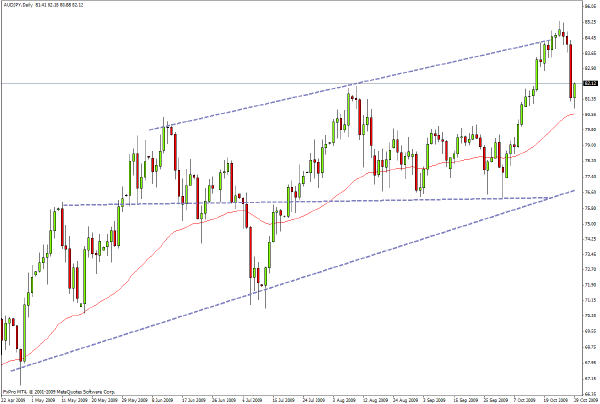
While watching the action in equities and foreign exchange, I was reminded of one of the lesser known technical analysis patterns which I have occasionally documented - the somewhat facetiously named Niagara Falls pattern which, unsurprisingly, resembles a massive waterfall. The intraday chart for the AUD/JPY cross rate quite clearly showed a waterfall pattern as those who could not get enough Australian dollars until recently, and used the yen as the funding currency, found themselves with two losing legs at the same time.
Looking at the longer-term pattern, the channel has been rejected at the upper level and the probability now suggests that a test of the bottom of the channel may be required in the intermediate term.
The question which poses itself in connection with such a possibility is the issue raised earlier this week - i.e. will equities and other risk appetite issues be able to withstand such a degree of dollar strength as many carry trades are unwound? There are reasons to be concerned that they will not.

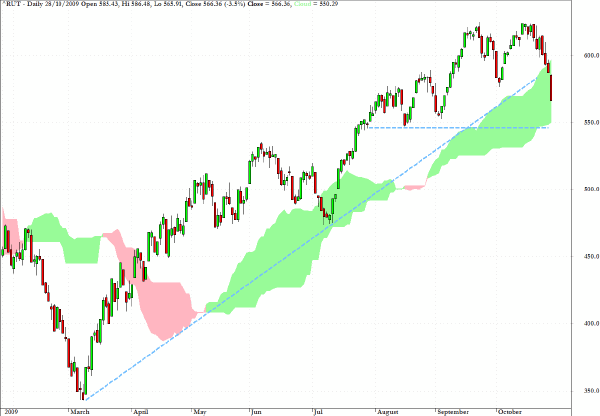
As a followup to a commentary earlier this week, the Russell 2000 acted as an early warning that the equity rally was overdone and now we have almost achieved the retrenchment to the 550 level that was anticipated here in recent comments.
Similar concerns arise for the viability of the support level provided by the chart support and Ichimoku cloud as were expressed in relation to the banking index.

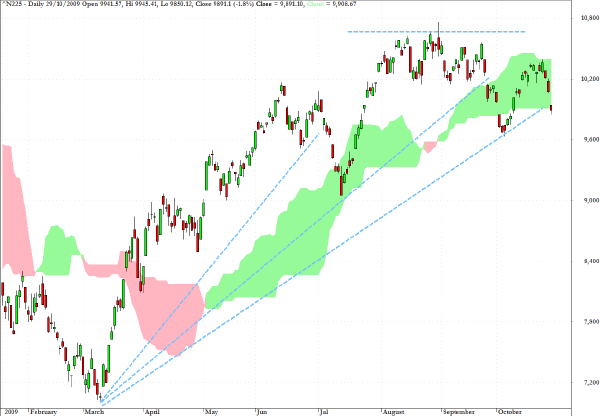
The Nikkei 225 (N225) chart is the most problematic of the ones which I scrutinized closely this morning.
The series of violations of the fan lines (not based on Gann angles) and the most recent break again below the 200-day EMA and below the green cloud, provides potentially the counter-argument that what is unfolding is just a "healthy" correction.
If the Japanese yen continues its strengthening, which again is tied into the carry trade and forex safe haven seeking, the prospect increases that the Nikkei may begin to show that the direction ahead for global equities is more decisively downwards.

Clive Corcoran is the publisher of TradeWithForm.com, which provides daily analysis and commentary on the US stock market.
|