| The McMillan Options Strategist Weekly |
| By Lawrence G. McMillan |
Published
10/29/2009
|
Options
|
Unrated
|
|
|
|
The McMillan Options Strategist Weekly
A correction of some ferocity has finally arisen, and it brought out the typical torrents of selling as stock owners all tried to get out the exit door at once. The most damage was done on Wednesday, but the market bounced back today, after positive economic news.

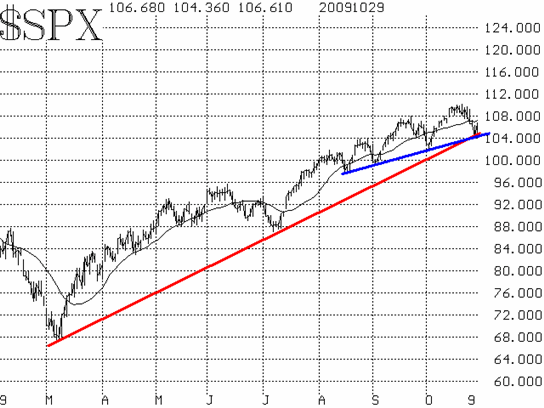
The $SPX chart is still bullish (Figure 1). The October lows at 1020 are a vital support area; a close below there would change the $SPX chart from bullish to neutral, at best. Note that a decline to 1020 would be a serious penetration of the March-July trend line, but that would actually be okay -- it would just reset the trendline at a slightly lesser slope. On the upside, there is heavy resistance near 1100, the level which could not be penetrated despite several attempts in mid- October.

Market breadth became extremely oversold this week. While that is a precursor to a buy signal, it behooves a trader to remember that the market can continue to decline during oversold conditions.

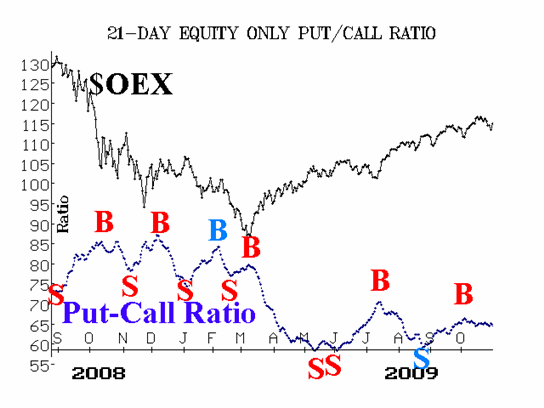
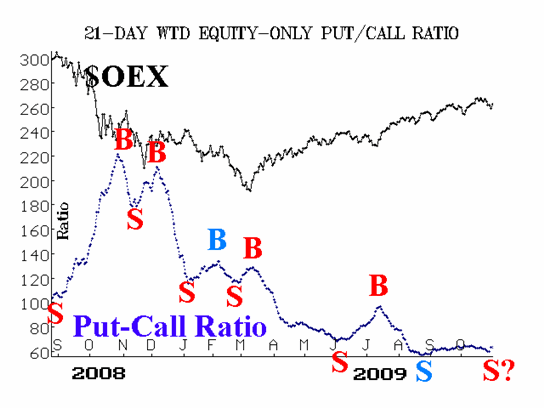
The equity-only put-call ratios continue to be distorted by heavy hedging activity.
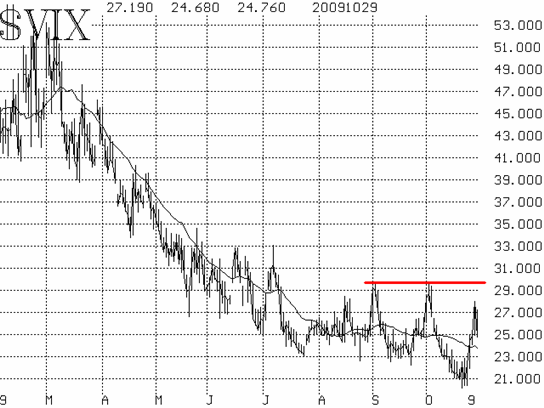
The volatility indices spiked higher this week, but then moved sharply lower with Thursday's rally. Only a series of higher highs and higher lows on the $VIX chart would turn the $VIX chart negative.

In summary, the correction that began about a week ago might theoretically continue for a while longer. A breakout above 1100 by $SPX would be extremely positive. On the other hand, a close below 1020 would be negative and should be treated as a serious breakdown.
Lawrence G. McMillan is the author of two best selling books on options, including Options as a Strategic Investment, recognized as essential resources for any serious option trader's library.
|