NASDAQ COMMENTARY
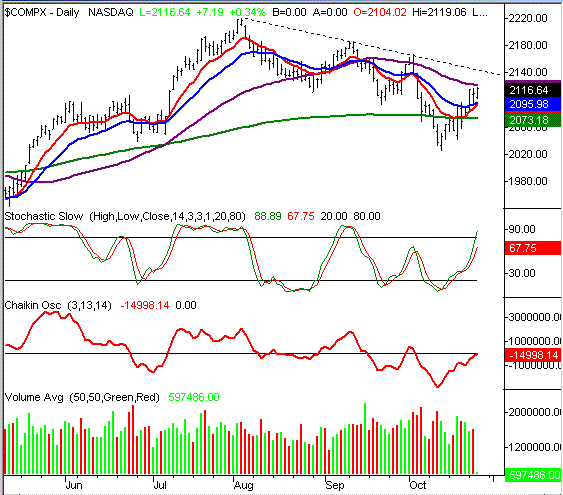
The NASDAQ appears to have shrugged off Tuesday's small dip, and instead is building on Monday's strength. The composite has already hit a high of 2119.06 for the week, and looks prepped to keep heading that direction. So far, we're up 31.5 points (+1.5 percent) from Friday's close, and have spent the entire week above that important 10 day moving average line (red). So in the short run, we're ready to be bulls. It's an intermediate-term barrier that we're now facing, and so far, traders haven't been brave enough to challenge it.
That intermediate-term barrier? The 50 day line (purple) looms overhead at 2122. That's only a few points away, so we're on the verge of breaking that resistance line. However, unless you're already long, it may be worth waiting to see if that average is going to be the stopping point for this surge. It was in mid-September......in a big way.
A quick recap may be in order. Although we're floating around 2113 right now, on the heels of a 76 point rally, don't forget that the rally began after a 118 point plunge. And that plunge took a heck of a lot less time to complete than the rally did. So while the current momentum is to the upside, the vulnerability of the market this year is tough to forget. That's why we need to see - at a minimum - a couple of closes above the 50 day average. Even then, though, we're skeptical; the most recent crosses of the 50 day had no bullish follow-through. So what we really need to see is a move past that longer-term resistance line (dashed). It's currently at 2145 and falling.
So while we're giving the benefit of the doubt to the bulls based on the current momentum, we'd really like to see some of those walls torn down before getting too excited.
NASDAQ CHART - DAILY

S&P 500 COMMENTARY
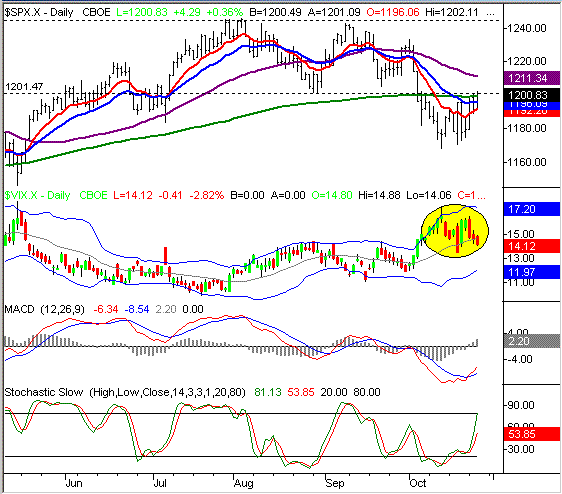
The S&P 500 is taking a swing at breaking some major resistance today, and if it actually holds its ground, it will be a major victory for the bulls. Specifically, the SPX is looking to make a close above that important (psychologically, anyway) 1200 mark. We actually saw trades as high as 1201 yesterday, but today's high of 1202.11 is even more progress. As it stands right now, the index is right at 1201, so we're on the right side of the line. On the other hand, a lot can happen between now and the closing bell.
Simultaneously, the S&P 500 is battling at the important 200 day moving average. It's at 1199, and closing above it would also be a major bullish milestone. So, needless to say, this is a pivotal moment.
Like the NASDAQ, we have to side with the bulls right now. The 10 day average has been precise support all week long, forcing the SPX to higher highs and higher lows over the last three days. Technically speaking, we need to see two closes above the 200 day line to get bullish in the long-term, and we also need to see two closes above the 10 and 20 day lines to get bullish in the short run. Well, odds are that we'll have the latter today (barring any major changes), and with any strength at all on Thursday, we'll see that second close above the 200 day line then. Throw in the fact that we also have a bullish MACD crossover, and it's difficult not to be bullish......that's why we are.
The only caveat is, again, the 50 day average. The S&P's 50 day line is at 1211. The 10 points between the current index reading and that 50 day line might make for a decent trade, but we'd be hesitant to trust the uptrend any farther than that. This year has been chock-full of sudden reversals, so we're staying alert for yet another one.
We're also plotting the VIX chart again, as it's a large part of the reason for our current bullish outlook. We still see a peak from October 13th, and though the downtrend took a pause last week for expiration, that downtrend looks like it's resumed. As you can see, that's been generally bullish for stocks.
S&P 500 CHART - DAILY

DOW JONES INDUSTRIAL AVERAGE
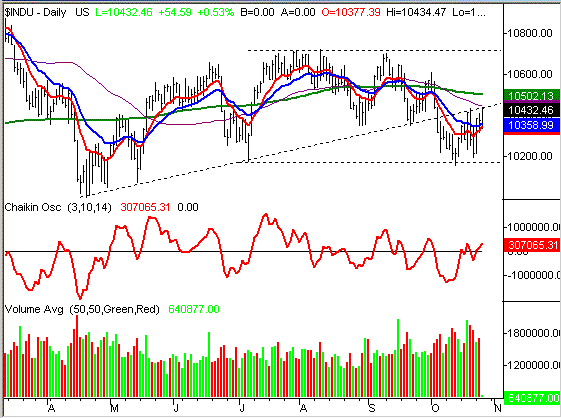
The story is the same as the NASDAQ's and the S&P 500's. The Dow is making a nice bounce off of recent lows, but has some significant resistance above. So, there's really nothing new here for the Dow. That resistance is both the 50 and the 200 day lines (which is the one unique thing about this chart - the Dow is facing both as resistance in the near future). And like the other indexes, it's the 10 day line holding the Dow up while it gathers steam.
And so far, that move has been impressive. The Dow has reached its high for the week as well, with today's high of 10432.78. That's just a fraction under the 50 day average, so the tension is building.
Other than that, reread the NASDAQ and the S&P 500 analysis. We're leaning on the bullish side of things here too, but our attitude is still basically 'prove it to me'.
DOW JONES INDUSTRIAL AVERAGE CHART

Price Headley is the founder and chief analyst of BigTrends.com.