| Corcoran Technical Trading Patterns For November 3 |
| By Clive Corcoran |
Published
11/2/2009
|
Stocks
|
Unrated
|
|
|
|
Corcoran Technical Trading Patterns For November 3
With three large reversal candlesticks being registered at the end of last week it should not have been too surprising that yesterday’s North American session gave an intraday version of the whipsaw/reversal pattern. No sooner had the "good news" been released than the usual suspects piled into the customary array of risk assets including SPY, QQQQ, Australian dollars etc. After about an hour it became apparent that the normal casualty during such exuberance - the US dollar - was not going to play nicely and plunge according to the scripts.
There were glimpses of the carry trade unwind at work in yesterday’s session and the reversal in the equity indices shows just how closely correlated so many asset classes have become, and when one part of the correlation stops working there are momentary anxiety attacks as highly leveraged funds have to re-think their commitments.
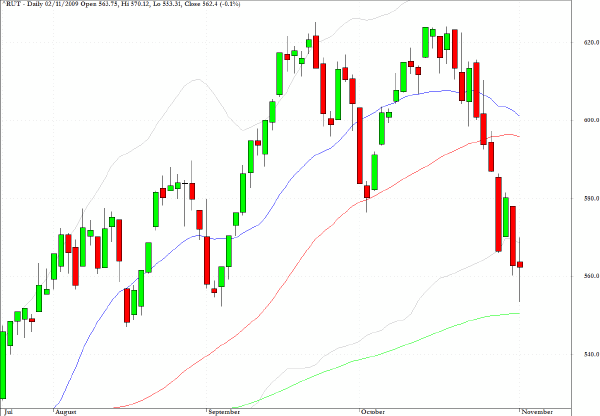
The Russell 2000 (RUT) almost completed the move back to 550 which I have been targeting and it would not be surprising to see that level reached today. Without laboring the point this index was the best leading indicator to the correction that we are now witnessing and may well provide clues, when it turns, as to when this sober reminder that the path ahead should not be as steeply upward as was seen between July and September.
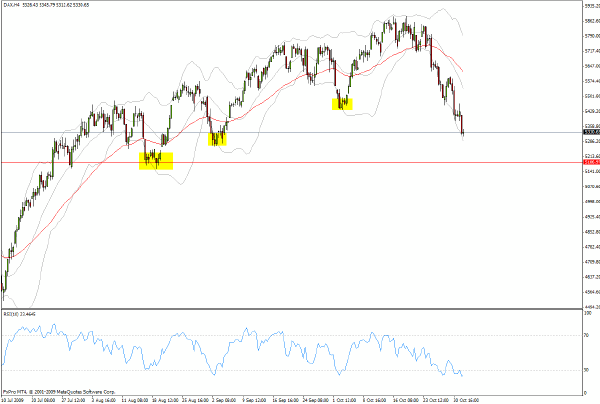
Germany’s DAX is struggling with a two percent decline while I am writing this, and a rather sarcastic notion has crossed my mind in view of the several lines of support or possible necklines that have been highlighted on the chart.
If one can see the point at which the right shoulder might begin to form but there is clear evidence of a dome formation in place, why not just cut to the chase? This is my more apocalyptic side coming to the fore but if Professor Roubini is right about the pending carry trade unwind, words like "crash" may not be too much of an exaggeration. Putting my more restrained hat back on again, a sober case can be made that this index has to reach back to 5140 or thereabouts before another leg up should emerge.
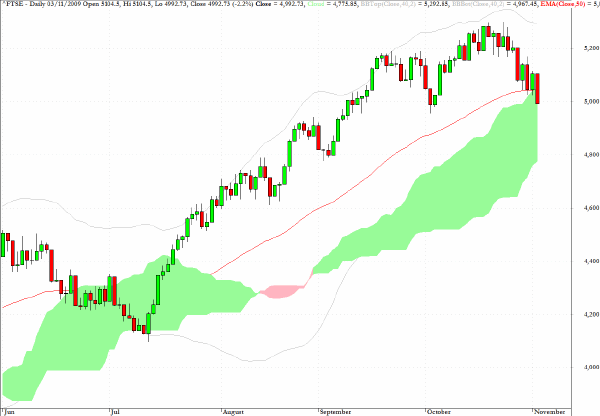
The FTSE in the UK has dropped below the 5000 level and as the chart suggests targets around 4800 are back in play.
The UK Treasury has announced yet another £25 billion of taxpayer support for Royal Bank of Scotland which takes the public interest in the bank to 85% and yet still the Chancellor uses quaint expressions about how the bank is now taking on a larger slice of risk than before this current re-organization. Why not just accept the fact that for all intents and purposes this bank is nationalized and that UK citizens would be left holding the bag if things don’t work out?
Perhaps again this is all a matter of attitude adjustment on my part.
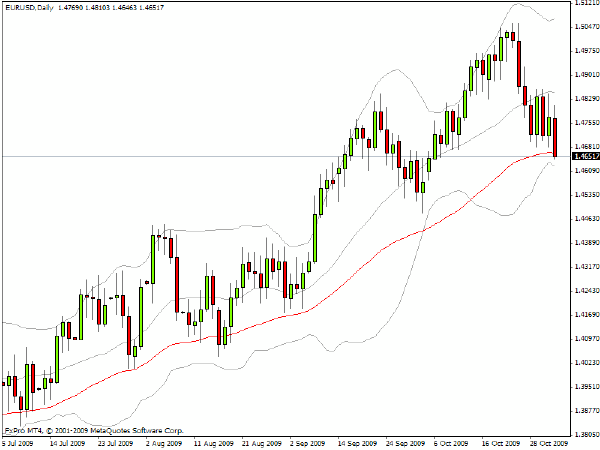
EUR/USD is poised at a fairly critical level of potential support but the prospects for more nervous asset re-allocations by the hedge funds could take this level out in today’s session.
It hardly needs to be said at this stage that further dollar strength will once again be "disruptive" for equities.
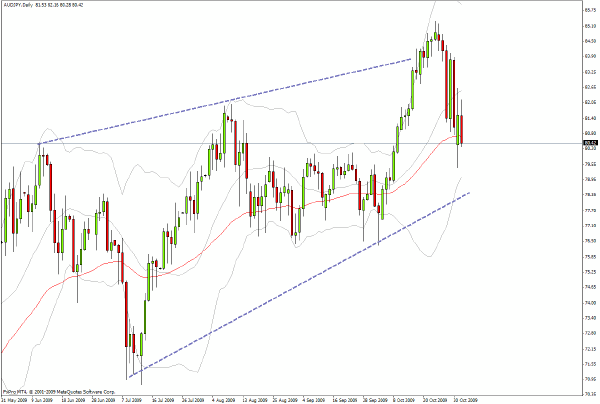
The AUD/JPY currency pair is performing exactly in line with the discussion here last Thursday and during the slot on CNBC where I discussed it.
Clive Corcoran is the publisher of TradeWithForm.com, which provides daily analysis and commentary on the US stock market.
|