| Corcoran Technical Trading Patterns For November 4 |
| By Clive Corcoran |
Published
11/3/2009
|
Stocks
|
Unrated
|
|
|
|
Corcoran Technical Trading Patterns For November 4
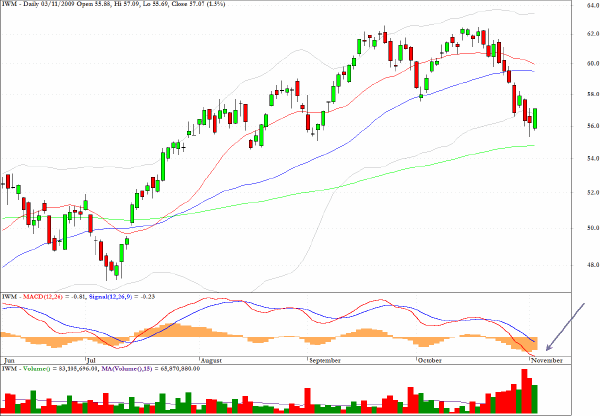
IWM, the exchange traded proxy for the Russell 2000, showed its favorable higher beta characteristics (from the long perspective that is) in yesterday’s session. It managed to gain 1.5% as opposed to the more anemic 0.3% gain from the S&P 500. The index has bounced just above the 200-day EMA, and although the target of 55 or 550 on the cash index was almost met, the MACD chart should be monitored in coming sessions for clear evidence that the downward momentum is subsiding.
If the small cap index can manage to produce some further gains outstripping the performance of the larger cap indices, and I would emphasize the conditionality of that statement, this would lend support to the notion that the recent correction may be almost finished.
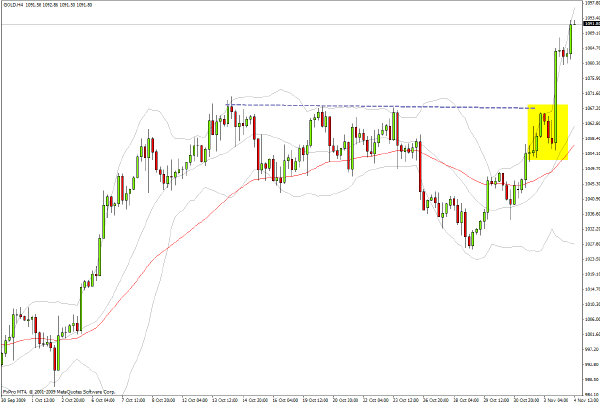
The chart for spot gold continues to display the type of pattern which was the focus of my commentary some weeks ago. The pullbacks which occur after the rounded basing patterns have almost completed (essentially this is the cup and handle pattern) show the continued scepticism regarding the viability for continued higher prices, whereupon the market surges again reflecting frantic short covering efforts by the disbelievers.
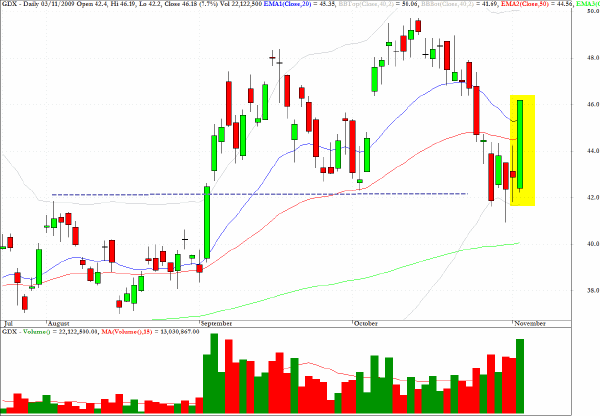
As suggested here last Tuesday, the sector fund GDX was a good trade after pulling back to the $42 level.
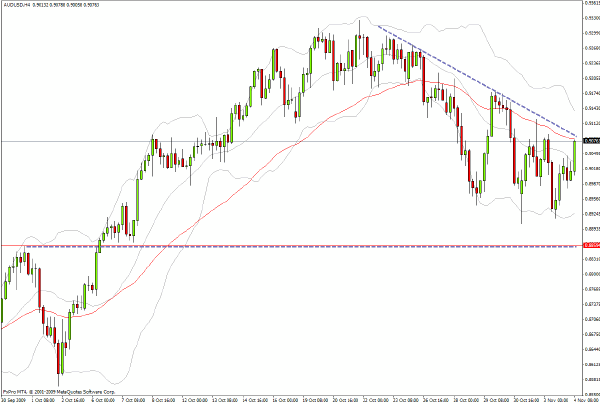
In yesterday’s trading, which I found a lot more fascinating than perhaps the net macro movements suggested, the equity bulls and dollar bears prevailed in the ongoing poker game concerning the sustainability of the carry trade.
The chart below shows that the AUD/USD pair is now confronted with the possibility of a break through the descending trend line through the recent highs.
I shall not dwell on the clear dome-shaped pattern to this chart as the sentiment against the US dollar seems pervasively hostile. While the Australian central bank has hiked rates twice recently, the Fed still seems to favor more accommodation and prolongation of ZIRP - or does it?
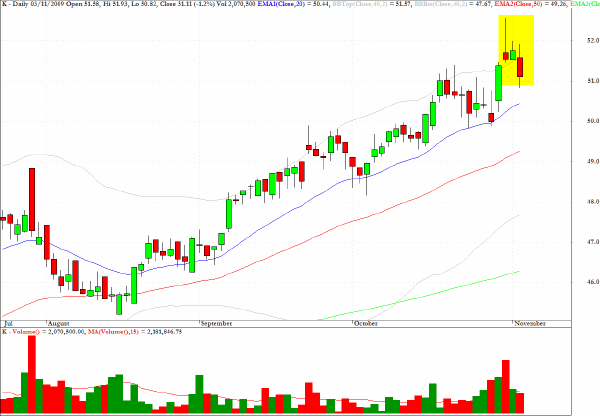
Kellogg (K) registered a very notable shooting star pattern at a multi-period high and the subsequent price action suggests strong overhead resistance.
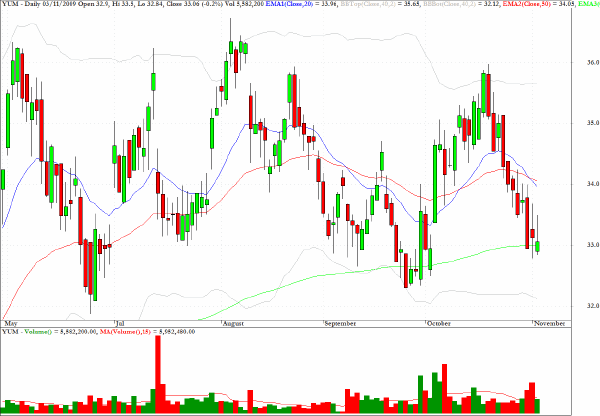
For those looking for easy to understand charts which do not rely on any grand design involving speculations about Fed policy, carry trades and the fate of the dollar, YUM looks to be at the bottom of a well-defined trading range.
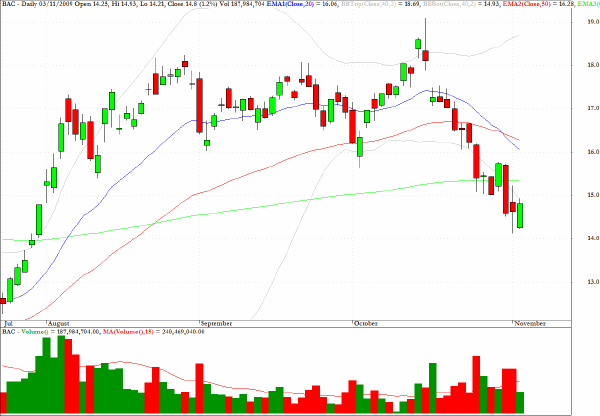
Bank of America (BAC) failed to impress yesterday despite the green candlestick which reveals an inside day pattern on reduced volume.
Clive Corcoran is the publisher of TradeWithForm.com, which provides daily analysis and commentary on the US stock market.
|