| Corcoran Technical Trading Patterns For November 6 |
| By Clive Corcoran |
Published
11/6/2009
|
Stocks
|
Unrated
|
|
|
|
Corcoran Technical Trading Patterns For November 6
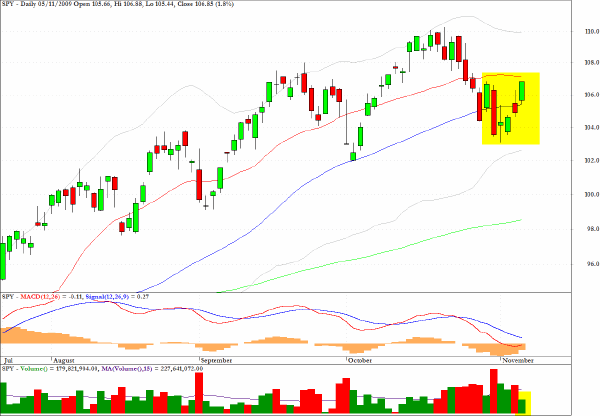
With a sustained effort the DJIA made it above 10,000 again and the S&P 500 managed a very respectable recovery to the 1066 level.
The inter-market tone was very interesting yesterday as there was a lot to digest with central bank decisions from the UK and the EU following on from Wednesday’s FOMC announcements. I continue to monitor the forex market carefully for clues as to any shift in sentiment regarding the dollar. Major hedge funds/trading desks are unlikely to wait to start implementing currency re-alignments until the official end of monetary easing is on the front page of the Wall Street Journal.
Volume was not impressive on the SPY and I would still be cautious on the long side - but clearly the short side is subject to very abrupt and painful squeezes as well.
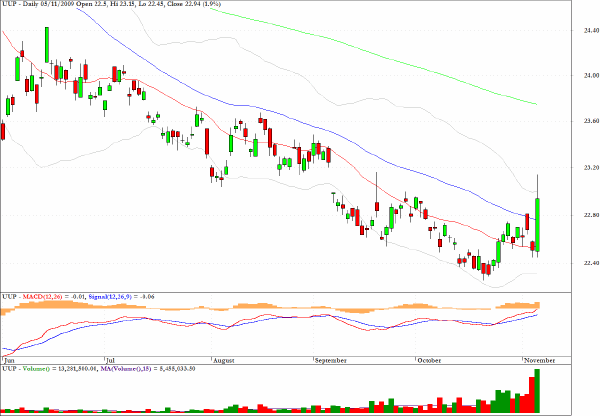
The chart below shows a rather extraordinary development in the exchange traded fund UUP which occurred at the end of trading yesterday. The large surge was not based on strength in the underlying dollar cross rates but rather on some internal re-organization of the ETF.
Here is the news report on this from Bloomberg.
The PowerShares DB US Dollar Index Bullish Fund ran out of shares and trading of the security was halted for about 45 minutes amid increased bets that the currency will rebound.
The exchange-traded fund that’s managed by Deutsche Bank AG and distributed by Invesco PowerShares Capital Management LLC had 6.6 million authorized units as of the close of trading Nov. 3, according to a filing with the U.S. Securities and Exchange Commission today. Its owners are seeking permission from the SEC, Financial Industry Regulatory Authority and National Futures Association to register another 100 million.
“There’s been a lot more interest in this ETF because investors are using it as a hedge on the dollar,” said David Stec, an ETF options trader at Group One Trading on the Chicago Board Options Exchange floor. “Yesterday, with the amount of options volume they saw, they probably have to add some shares. The ETF is based on the dollar versus a basket of currencies, so if there aren’t enough shares it might trade at a premium.”
The fund, also known by its UUP ticker symbol, rose 1.9 percent to $22.94. The ETF surged from $22.49 when trading was halted at 1:06 p.m. The U.S. Dollar Index, a six-currency gauge of the greenback, added 0.1 percent to 75.72. Its price is 3.3 times higher than the UUP, down from a ratio of 3.36 yesterday and a 28-month high of 3.38 on Oct. 19.
The Dollar Index sank to a 14-month low of 74.97 on Oct. 21. Trading volume on the PowerShares ETF jumped to a record 10.9 million yesterday and today’s volume of 9 million was eight times higher than the average this year.
Trading of bullish options on the ETF jumped to a record yesterday as the Federal Reserve said it plans to keep interest rates at “exceptionally low” levels for an “extended period.” Almost 400,000 calls giving the right to buy the fund changed hands, almost 12 times the four-week average and more than 141 times the volume for puts giving the right to sell.
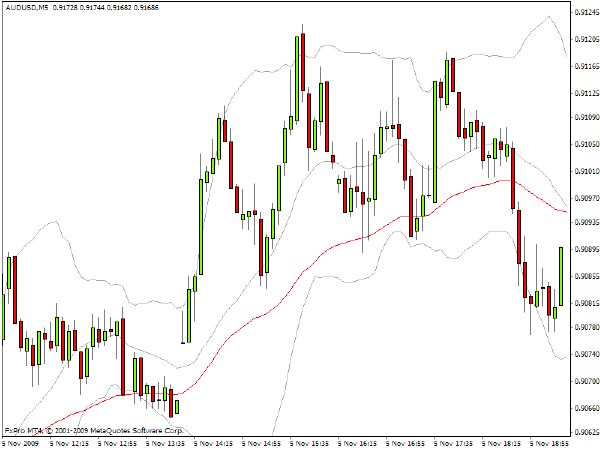
The chart below shows the intraday movements of the AUD/USD pair in yesterday’s trading. The granularity I have shown is the 5-minute version to convey the sense of the volatility of this pair.
Whipsaw behavior as illustrated on the chart can be indicative of both anxious trading and also could be pointing to illiquidity. One of the comments that I made on my blog yesterday was that, to a larger extent than I believe is healthy, the US capital market is becoming overly dependent on the liquidity in certain forex pairs such as the AUD/USD.
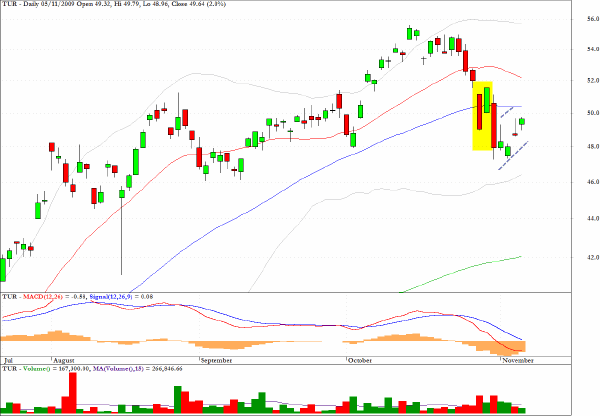
The exchange traded fund TUR tracks the Turkish equity market and has the characteristics of a bear flag.
This is my comment from Wednesday’s column.
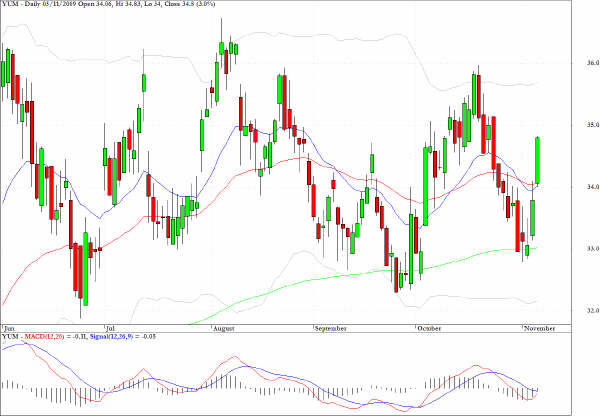
For those looking for easy-to-understand charts which do not rely on any grand design involving speculations about Fed policy, carry trades and the fate of the dollar, YUM looks to be at the bottom of a well-defined trading range.
Buying the open on Wednesday would have delivered a 5% return in two days.
Clive Corcoran is the publisher of TradeWithForm.com, which provides daily analysis and commentary on the US stock market.
|