| The McMillan Options Strategist Weekly |
| By Lawrence G. McMillan |
Published
11/6/2009
|
Options
|
Unrated
|
|
|
|
The McMillan Options Strategist Weekly
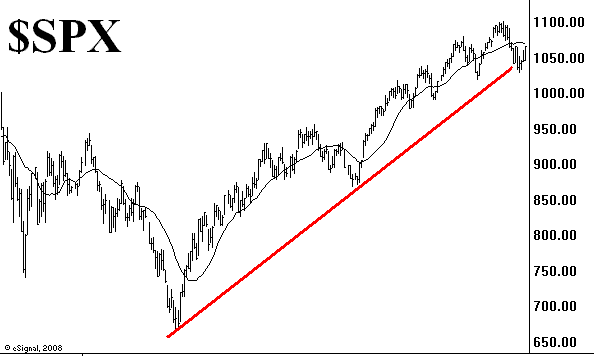
The chart of $SPX has remained bullish since the pattern of higher lows is still in force. The latest correction took $SPX down to 1030. The October lows are 1020. On the upside, there is resistance at 1065-1070, and then above that at the recent highs near 1100.

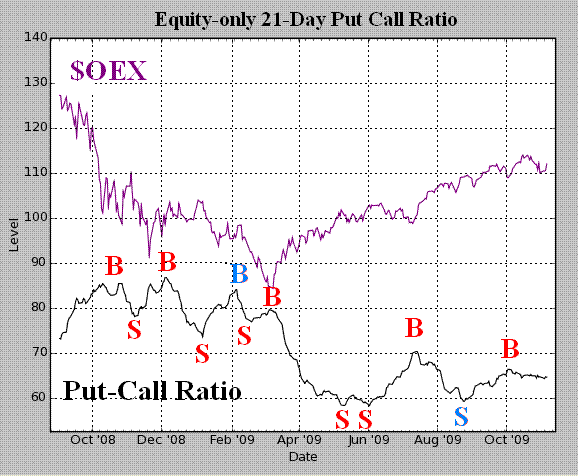
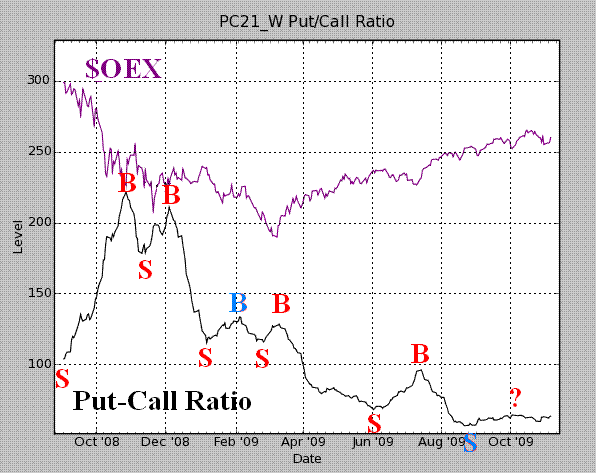
Equity-only put-call ratios appear to still be feeling the effects of the heavy hedging activity that took place this summer and fall. For the record, the standard ratio is on a buy signal, while the weighted ratio is on a sell.

Market breadth has been a reliable indicator during the rally since the March bottom. The recent correction saw our breadth oscillators reach extremely negative, oversold levels. This week, however, breadth has generally been positive, culminating with a very strong showing of advances over declines today.

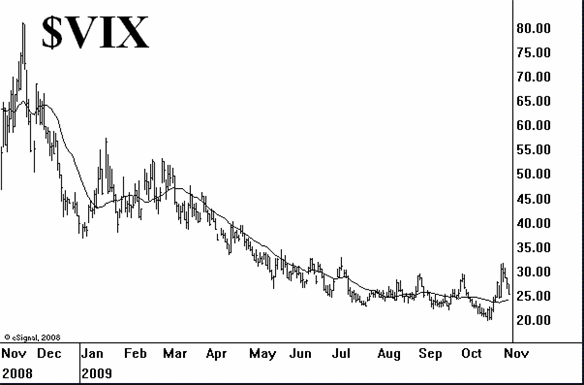
Volatility indices spiked up last Friday, as many traders panicked to buy $SPX puts. The rally this week, though, has seen a virtual collapse in $VIX and other volatility indices. Most likely is this: $VIX falls below 25, and the $VIX chart thus once again takes on the appearance of a downtrend, which is bullish for stocks.

We view the current market as bullish. We would expect $SPX to exceed the resistance at 1070 (it would be bearish if that resistance held) and challenge the highs at 1100. The wild card is today's Unemployment Report; if it is negative and $SPX falls back from here, then it would be in a trading range between 1030 and 1070 and we'd have to await a new breakout at a later time.
Lawrence G. McMillan is the author of two best selling books on options, including Options as a Strategic Investment, recognized as essential resources for any serious option trader's library.
|