| Corcoran Technical Trading Patterns For November 9 |
| By Clive Corcoran |
Published
11/9/2009
|
Stocks
|
Unrated
|
|
|
|
Corcoran Technical Trading Patterns For November 9
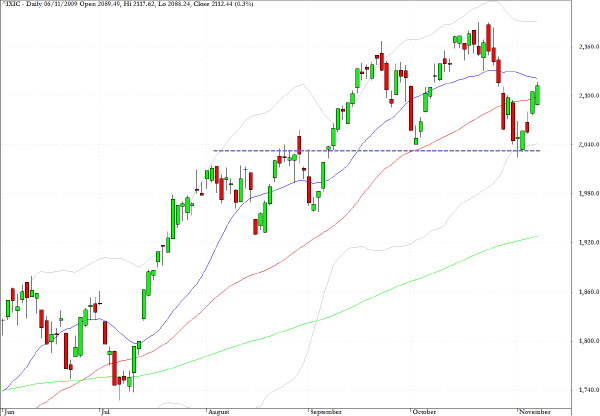
The Nasdaq Composite (IXIC) appears to be retracing the pattern of recovery from mid-September to mid-October which arose at the 2040 level, which is clearly a line of major support that the bears were unable to take out during the late October selling.
The pattern developing suggests that a further move back towards the mid-October highs should be expected, but the more acute technical concerns would arise if this move begins to show a further failure to sustain closes above 2160.
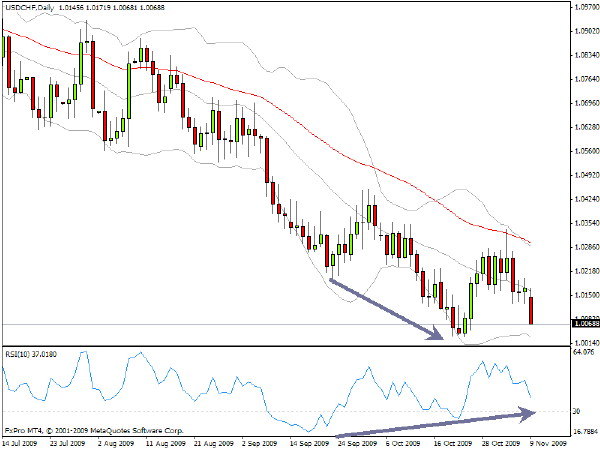
In European trading on Monday morning, the US dollar is yet again being sold against almost all currencies. The chart for the USD/CHF shows that the dollar is reaching back towards parity.
The RSI chart segment is pointing towards some suggestion that the recent sell-offs are seeing less momentum and conviction but the belief that the dollar is headed lower has almost become unanimous.
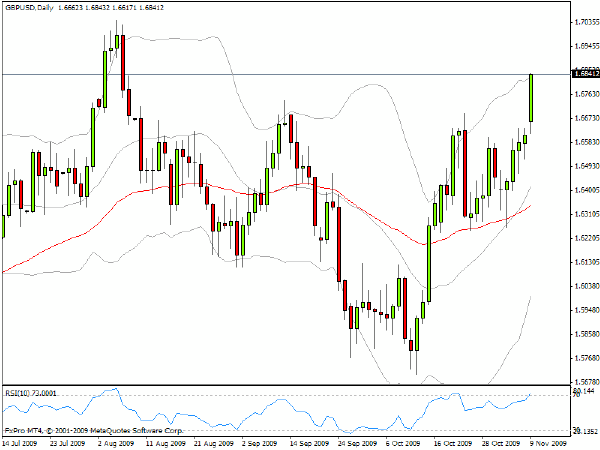
Sterling appears to be headed towards a test of the $1.70 level which is somewhat extraordinary given the economic circumstances of the UK economy. Much of the movement today can be attributed to some very active cross trading with the euro where the UK currency appears to be breaking below the 0.89 level which some have claimed will lead to a more dramatic recovery of the UK currency against its eurozone counterpart.
There are layers of hurdles ahead for this sterling recovery against the euro, and I do not see a favorable reward/risk ratio for further gains of sterling against this currency, and even against the dollar we are approaching an area where I would be looking to pocket any gains and not be adding to long GBP/USD positions.
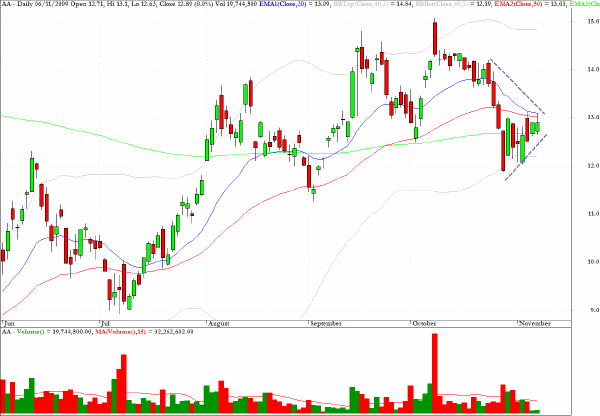
Alcoa (AA) has a very pronounced triangular pattern which suggests that a breakaway pattern is imminent.
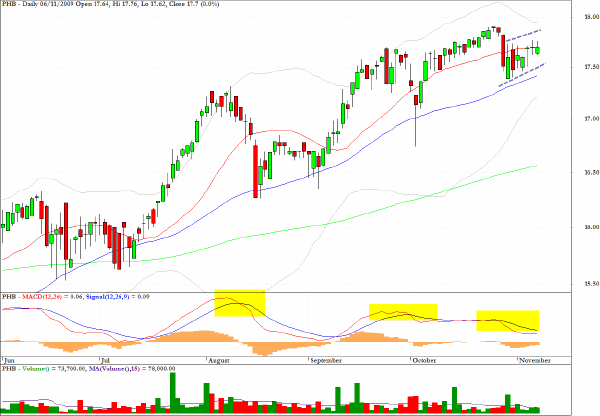
PHB, the PowerShares High Yield Corporate Bond exchange traded fund, looks vulnerable.
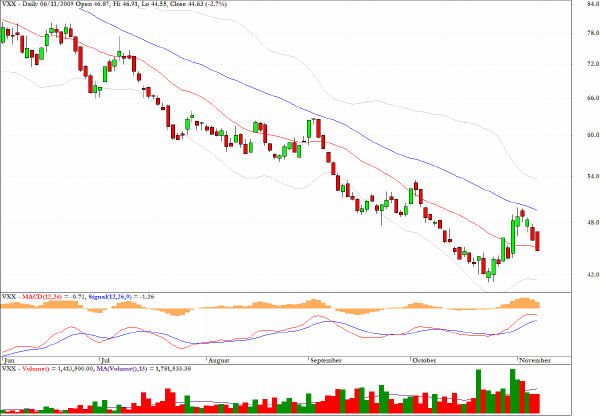
VXX, which represents a short-term play on heightened volatility, has sold off for the last four sessions and would appear to be worthy of attention on the long side as the complacency mounts.
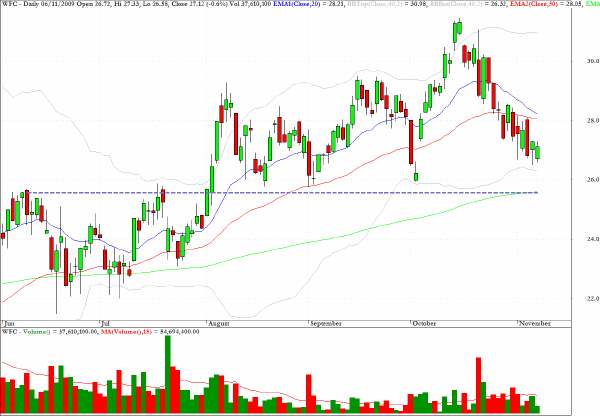
Wells Fargo (WFC) should find some support at the level indicated on the chart which sees a support/resistance level which coincides with the 200-day EMA.
Clive Corcoran is the publisher of TradeWithForm.com, which provides daily analysis and commentary on the US stock market.
|