| Corcoran Technical Trading Patterns For November 11 |
| By Clive Corcoran |
Published
11/11/2009
|
Stocks
|
Unrated
|
|
|
|
Corcoran Technical Trading Patterns For November 11
Yesterday was another fascinating example of the turbo-charged relationship between the FX carry trade and the major US equity indices. After a strong opening rally around 12.30 New York time yesterday when the S&P 500 was pushing towards its high for the session, there were suddenly huge liquidity gaps in key forex rates as the euro, sterling and especially the Australian dollar cascaded downwards in the absence of any bids. As soon as the currencies returned to their earlier session lows, and after the S&P 500 had dropped back several points the slow but steady selloff in the dollar resumed and equities moved higher.
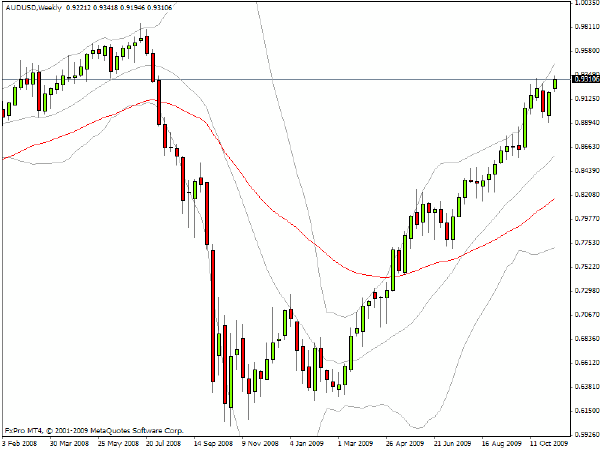
Where might the S&P 500 be headed? Well perhaps the chart of the AUD/USD might act as our guide!
As can be seen from the weekly chart, there are still about 4 cents left to go on the Aussie currency’s parabolic ascent and increasingly it appears that the market will be stretched back to extreme levels while there seems to be little, if any, resistance for the carry trade to expand and for hedge funds to sell the dollar and step out further into risk assets.
Once we get back to the summer 2008 levels in the Aussie dollar, we could have a severe bout of vertigo. Somewhere in the next few weeks, maybe sooner than that, it could, to paraphrase the words of another song, be a case of "It’s raining Australian dollars". If so, be sure to bring along steel umbrellas (and crash helmets).
If the diagnosis above is correct on the temptation to push the carry trade back to bursting point, what are some likely targets for various global equity indices?
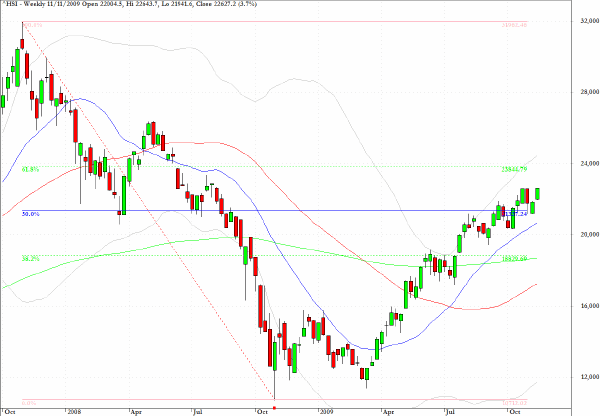
I have updated my target for the Hang Seng index as seen on the fibonacci retracement levels seen on the chart below. After some consolidation at the 50% level we now seem headed towards the next obvious target level for those that like to live dangerously, which is at the 62% level or about 24,000.
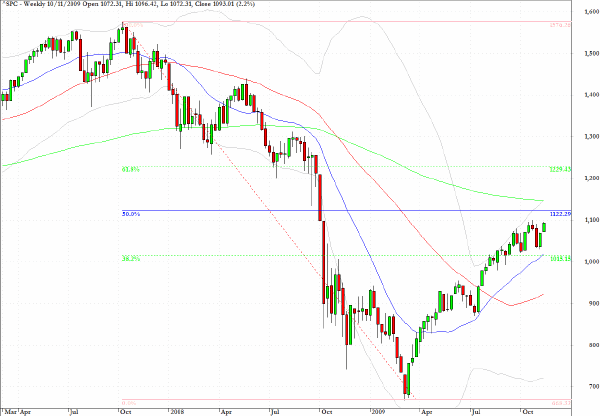
The S&P 500 could be the surprise element that would catch all of the FX traders who are short the dollar on the wrong side of the market. It is quite important that the US benchmark index takes out the 1100 level soon and, if so, I would suggest that the 1120 level is the next threshold to be crossed.
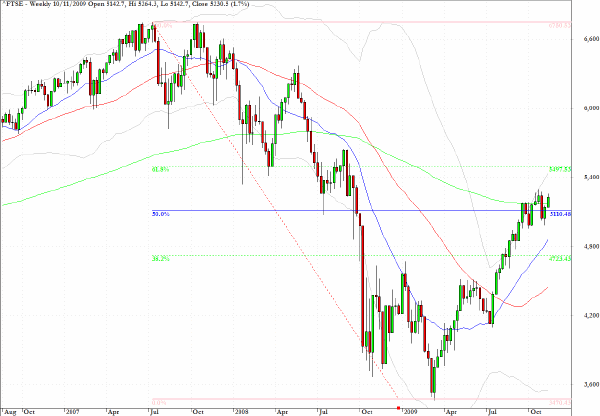
As anticipated here during October, the 5200 level proved to be a strong resistance barrier for the FTSE 100 however with that being penetrated, and provided that the S&P 500 is not stopped in its tracks in the next few sessions and fails to move above the 1100 level, then the target for the UK index would be just below 5500 as the fibonacci grid on the chart below suggests.
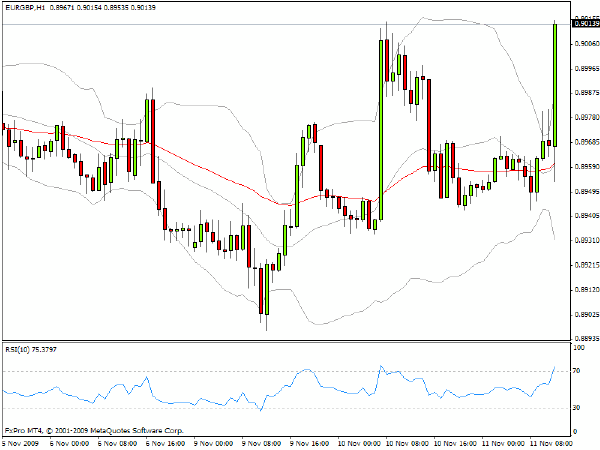
EUR/GBP seems destined to head towards the .9070 level as discussed here yesterday. Comments from the B of E today which spoke about the desirability of a weak pound to aid exports has only accentuated the technical conditions which were noted here in yesterday’s column.
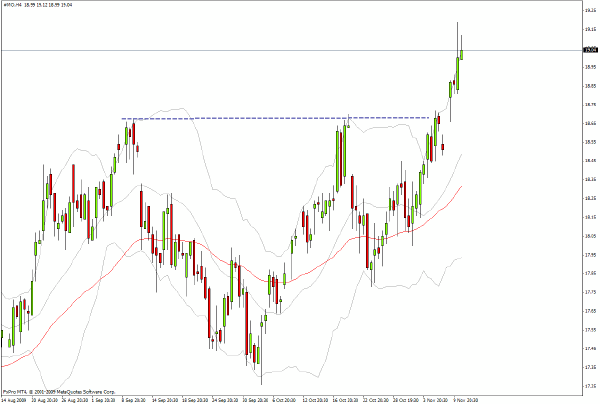
Altria (MO) displays a nice example of a cup and handle pattern formation which has evolved over the last few sessions and the breakout pattern is an encouraging sign for those favoring the large stocks. As also intimated in recent commentary here, the small cap stocks are still failing to rally in line with the larger cap multi-national stocks and this is indicative of a market which is not showing the signs of a typical fully fledged bull phase.
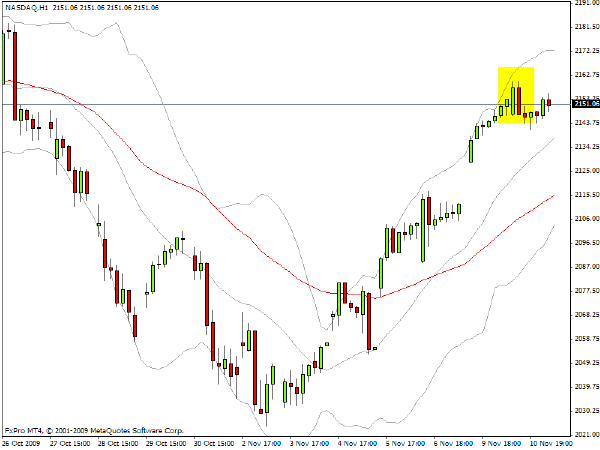
The Nasdaq Composite (IXIC) hit resistance exactly at the 2160 level that was discussed yesterday, and I would suggest careful monitoring of this index in today’s session since evidence that US equities may be about to top out would probably surface with respect to this index before they become obvious on the intraday S&P 500 charts.
Clive Corcoran is the publisher of TradeWithForm.com, which provides daily analysis and commentary on the US stock market.
|