| Corcoran Technical Trading Patterns For November 12 |
| By Clive Corcoran |
Published
11/12/2009
|
Stocks
|
Unrated
|
|
|
|
Corcoran Technical Trading Patterns For November 12
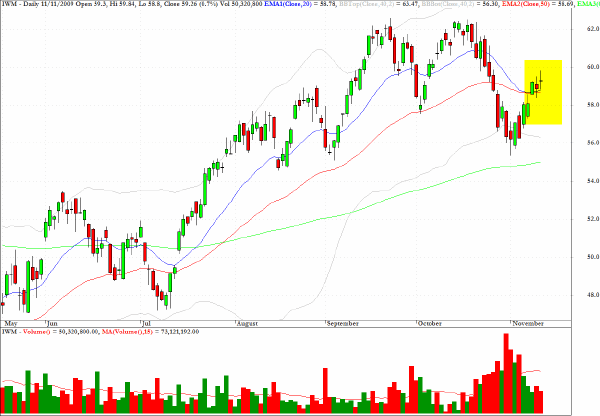
IWM, the exchange traded fund which tracks the Russell 2000, continues to register formations which are not reassuring for the bullish argument.
There is no denying that the mountains of zero interest rate credit being created by the world’s central banks remains a major plus for equities, but the fact that institutional investors are becoming more selective and focusing more on the large-cap stocks and the macro index plays, suggests that sentiment is becoming gradually more risk averse and that there is a reluctance to buy into the robust version of the global recovery story.

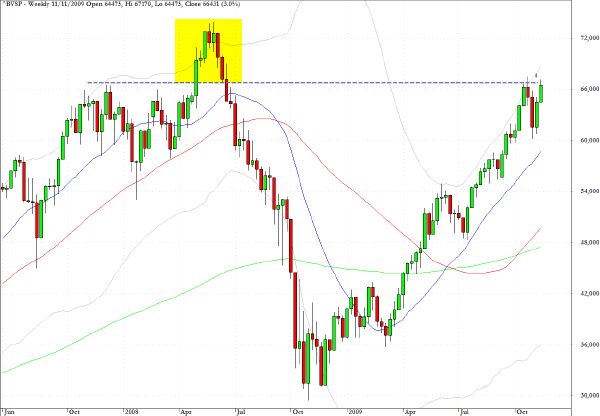
The weekly chart for the Bovespa index in Brazil shows just how extraordinary the V-shaped recovery from the 2008 lows has been as this index has more than doubled since late last year. If one excludes the area highlighted on the chart from the spring of 2008, the proximity to previous resistance levels is yet another reason to believe that investors’ ardour for emerging markets, which have been soaking up an enormous amount of easy "hot" money can, as previous episodes such as the Asian crisis of 1997 have shown, be very fickle when unease develops about the sustainability of such rewarding adventures.

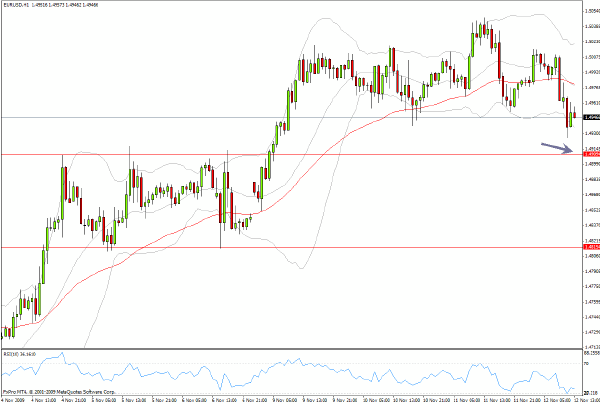
EUR/USD could test support today at the $1.49 level and then a more critical test would be faced at the $1.4815 level.

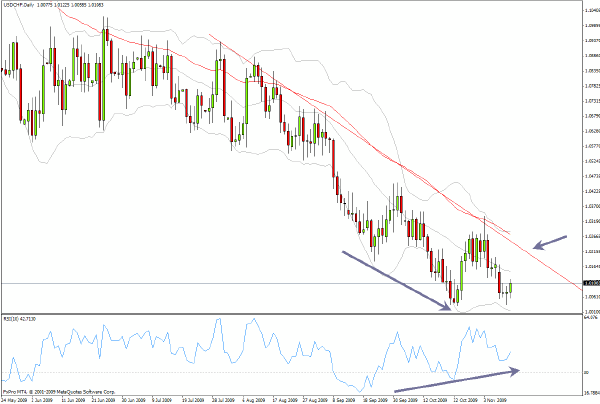
The daily chart for USD/CHF shows that positive RSI divergences, which I have noted here recently on shorter time frame charts, are unfolding as the attempts to push down to the parity level appears to have stalled.
If the US currency can break the descending red trendline which coincides closely with the 50 period EMA, one should expect some rather brisk short covering action.

Clive Corcoran is the publisher of TradeWithForm.com, which provides daily analysis and commentary on the US stock market.
|