| Corcoran Technical Trading Patterns For November 13 |
| By Clive Corcoran |
Published
11/12/2009
|
Stocks
|
Unrated
|
|
|
|
Corcoran Technical Trading Patterns For November 13
Global equities received a teaser of what might happen when the tide eventually turns for the US dollar. The intraday action for US equities clearly revealed that the driver of yesterday’s slow attrition in stocks was the manner in which FX traders were pressuring, in a well orchestrated manner, most foreign currencies and in particular, the Australian dollar, Canadian dollar and the Euro.
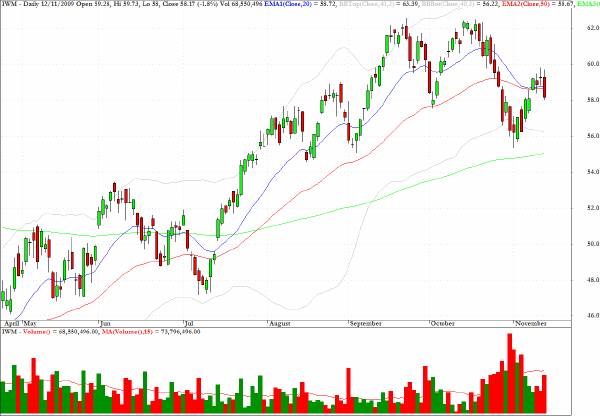
As is becoming customary, the small cap stocks demonstrated that high beta is not the place to be when the animal spirits are waning. The action in IWM was one of the most decisive with a break below key moving averages and reasonably substantial volume, considering that other index proxy ETF’s showed below average volume.
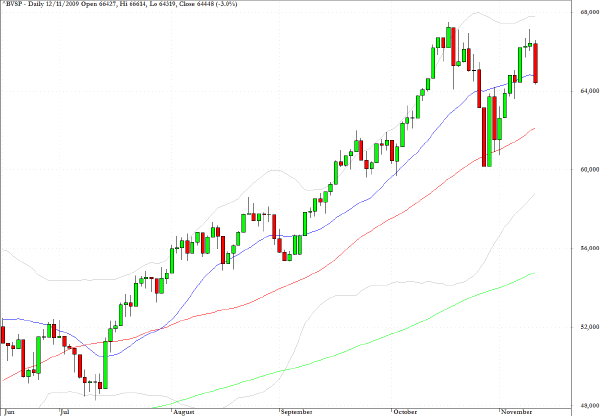
The Bovespa index in Brazil wobbled at the 66000 level as anticipated and fell by 3%. The EWZ exchange traded fund provides an opportunity to take a view on this key component of the BRIC geographical sector, but notably yesterday there was a lack of strong volume on the downward move suggesting that those intrigued by the emerging markets are not yet convinced that the tide has turned.
Even the performance of the VIX yesterday suggested that, despite some clear signs that fund managers were rattled by signs of life in the moribund dollar, the presumption is still that further progress for equities lies ahead.
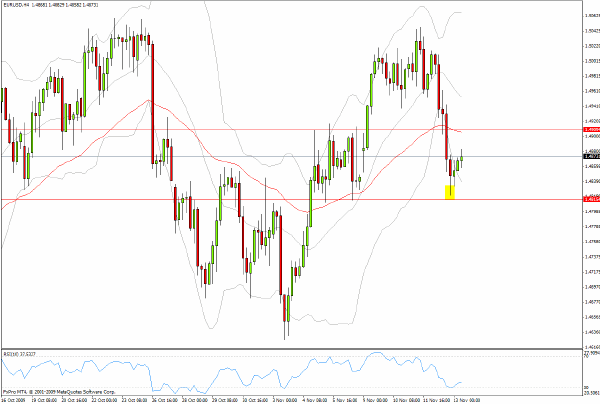
The euro found support at $1.4820, just above the level indicated by the lower red line which was included in my chart in yesterday’s column.
If the currency finds difficulty in regaining its foothold above the $1.49 level in today’s session, the lower levels seen on the chart would seem to be back in play in the intermediate term.
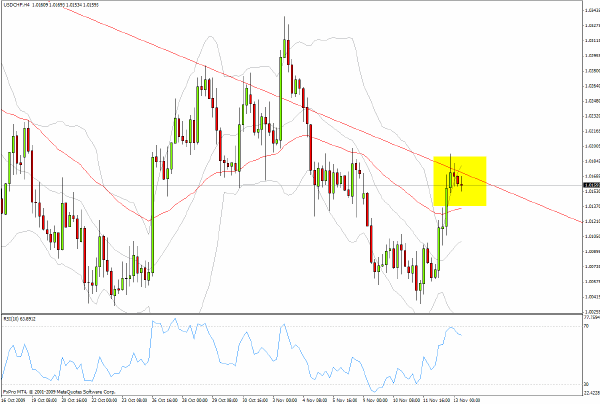
Also, yesterday’s comment on the possibility of an evolving basing pattern in the Swiss Franc is illustrated by the charts from yesterday on USD/CHF. The Swiss currency moved up to exactly the long-standing downward trendline, and it would not be surprising to see some consolidation in today’s session before there is another attempt to break through.
The consequences for asset allocators of a decisive shift towards a more positive sentiment for the US currency should not, in my view, be under-estimated.
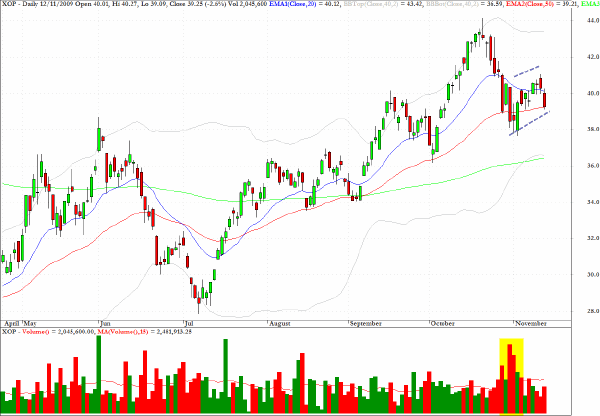
There is a fairly well-defined bear flag with the appropriate volume characteristics for XOP, an ETF which tracks the energy exploration sector.
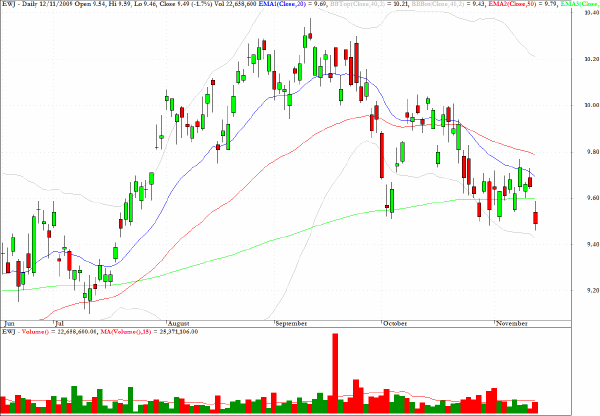
EWJ, as a tracker of Japanese equities, reveals one of the few sector funds which is trading below its 200-day EMA, and areas of obvious chart support are apparent back at the levels seen in early July.
Clive Corcoran is the publisher of TradeWithForm.com, which provides daily analysis and commentary on the US stock market.
|