| The McMillan Options Strategist Weekly |
| By Lawrence G. McMillan |
Published
11/12/2009
|
Options
|
Unrated
|
|
|
|
The McMillan Options Strategist Weekly
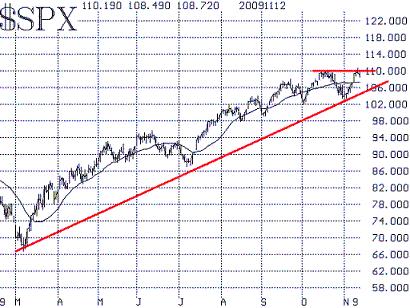
The October highs and now the November highs are at essentially the same level-- $SPX 1100. This is major resistance, which is reinforced by the presence of the declining 500-day moving average at this 1100 level.

A breakout above 1100 would be bullish, and could probably propel prices to the 1150 level without much trouble. However, a failure at 1100 means that support areas would be important. There is support at 1160-1170, near the 20-day moving average, and then below that at 1030, the late October lows, followed by 1020, the early October lows.

There are now breadth sell signals as of today's failure at 1100. Also, there is a matter of negative divergence: breadth rose to much higher levels when $SPX first visited 1100 a month ago.

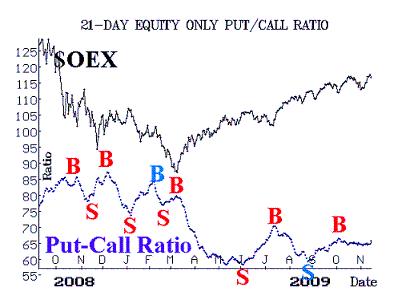
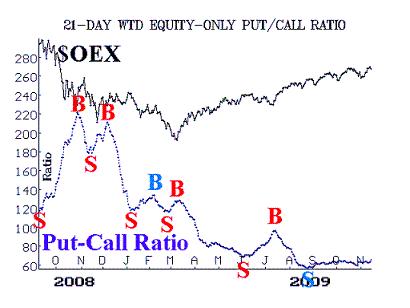
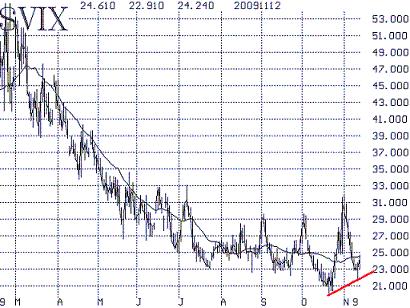
Equity-only put-call ratios have still not returned to useful status, after having been distorted by the heavy hedging activity that has taken place over the past few months. There is some evidence in the $VIX futures market that the hedging activity is abating. If so, the put-call ratios should return to "normal" status shortly.

In summary, the intermediate-term trend of the $SPX chart continues to be bullish. However, there are several potential short-term negatives which mean that another correction could be about to emerge. A close above $SPX 1100, however, would essentially end bearish thoughts.
Lawrence G. McMillan is the author of two best selling books on options, including Options as a Strategic Investment, recognized as essential resources for any serious option trader's library.
|