| Corcoran Technical Trading Patterns For November 16 |
| By Clive Corcoran |
Published
11/15/2009
|
Stocks
|
Unrated
|
|
|
|
Corcoran Technical Trading Patterns For November 16
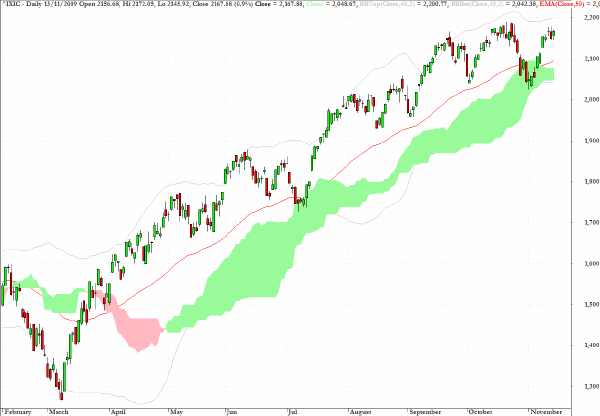
The Nasdaq Composite (IXIC) closed Friday’s session at the 2167 level and now looks set to tackle the previous recent intraday high of 2190 from October 23.
Reviewing the simplified Ichimoku chart below, it is quite remarkable how simple the pattern has been since the March low. Whenever the index has retreated to the green cloud, at which points it has also tagged the 50-day EMA, buying support has emerged to take the index higher.
It is hard to avoid the conclusion that this is a fundamentally up-trending market with underlying dynamics which suggest that the dips are persistently seen as buying opportunities. Until the evidence shifts on this interpretation, those who conduct the occasional bearish raids on this and other equity indices will have to satisfy themselves with opportunistic gains if they cover quickly enough or losses if they become too passionate about their belief that this market is unsupported by the fundamentals.
Not being much of a believer in the notion that one can determine the "fundamental value" of equities, the simple adage that the trend is your friend captures the flavor of the rewards obtained by those who have taken the ride up since the piercing of the pink cloud in early April.
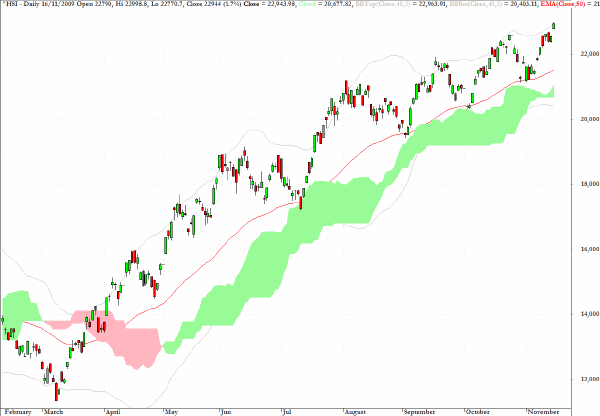
Similar comments to those made above can be applied to the Hang Seng Index in Hong Kong which seems to be headed towards the 24000 target discussed here last week. As is also evidenced by the accompanying chart, only once in early July has this index even pierced the green cloud, and, on every occasion when it has been tested, the 50-day EMA has provided immediate support.
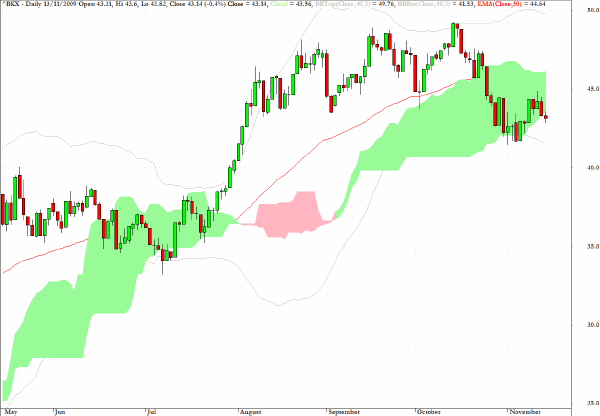
In contradistinction to the analysis provided for the two charts above, the KBW Banking Index (BKX) is one of the few of the major sector charts to reveal a drop below the green cloud.
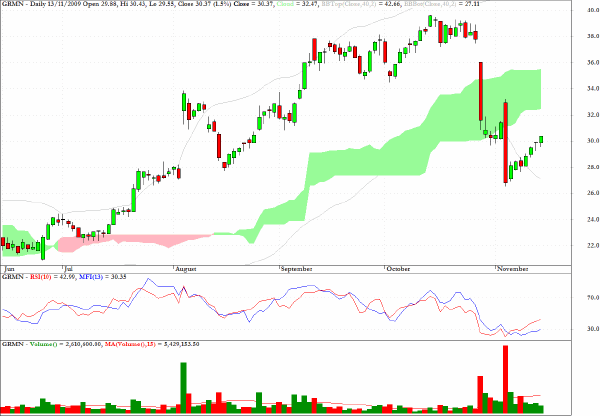
Garmin (GRMN), active in the satellite navigation field which now faces a possible broken business model as Google begins deployment of a competitive service which is essentially free, looks vulnerable to further weakness.
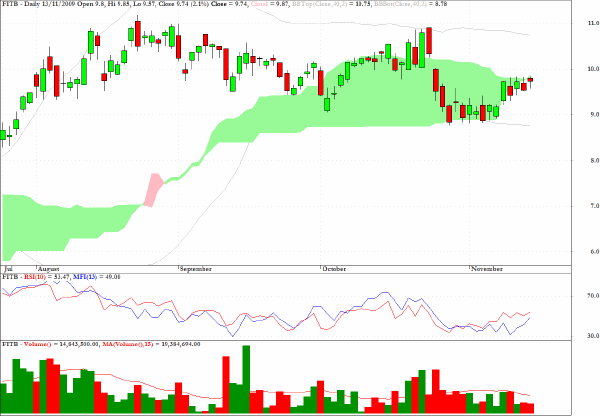
Fifth Third Bancorp (FITB) is just one of a number of financials which seem to have lost upward momentum.
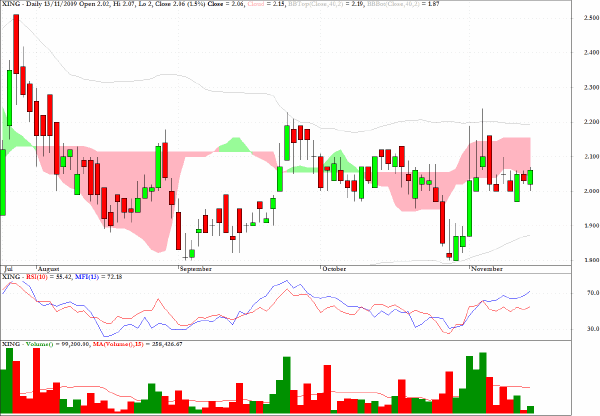
XING is in a tight range but the MFI and volume charts are suggesting that an upward breakout could arise in coming sessions.
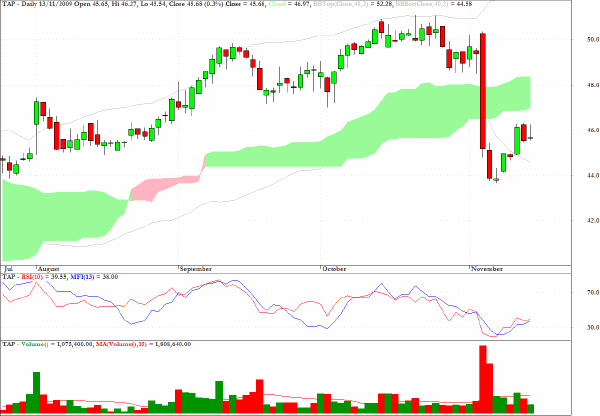
Molson Brewing (TAP) could be approaching the top of a bearish pullback channel.
Clive Corcoran is the publisher of TradeWithForm.com, which provides daily analysis and commentary on the US stock market.
|