| Corcoran Technical Trading Patterns For November 20 |
| By Clive Corcoran |
Published
11/20/2009
|
Stocks
|
Unrated
|
|
|
|
Corcoran Technical Trading Patterns For November 20
As discussed in yesterday’s commentary, the FX market provided a hostile environment for US equities during the earlier part of the session.
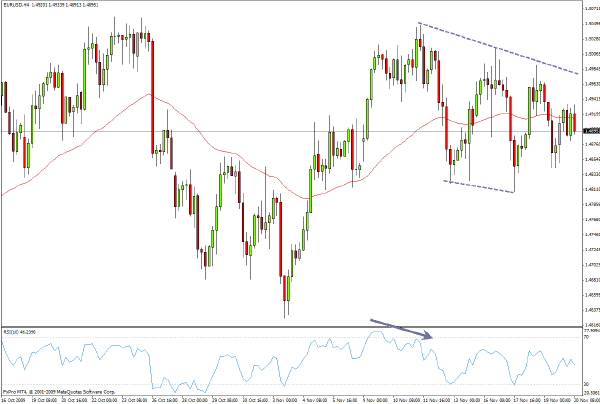
A lot of attention should presently be focused on the EUR/USD cross rate as there is now a good case to be made that the eurozone currency has failed three times to gain a foothold above the $1.50 level and may have reached an intermediate-term high against the US currency. This currency pair is one that I plan to discuss during a slot on CNBC’s European Closing Bell this afternoon at approximately 16:40 London time.
The euro appears to be entering a channel which has lower highs and lower lows. The currency is well supported at $1.4850 and even more so at $1.48, but should the lower of those levels fail, the tide could begin to turn tide for the US dollar with all of the associated risks to equities.
Meanwhile, the long side of EUR/GBP looks constructive as sterling continues to weaken.
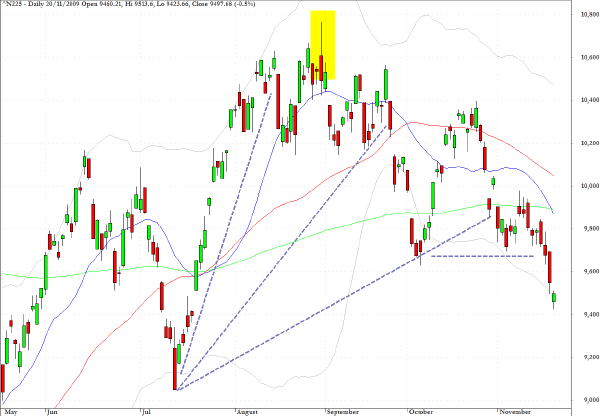
The Nikkei 225 lost another 0.5% in Asian trading during Friday’s session, but at least managed to register a green candlestick after gapping down and opening almost at the 9400.
I have summarized the negative pattern on this chart several times recently and although a short term rebound may have been signaled by the support found at the lows today, it seems increasingly probable that this index will eventually face another test of the 9000 level in the coming weeks.
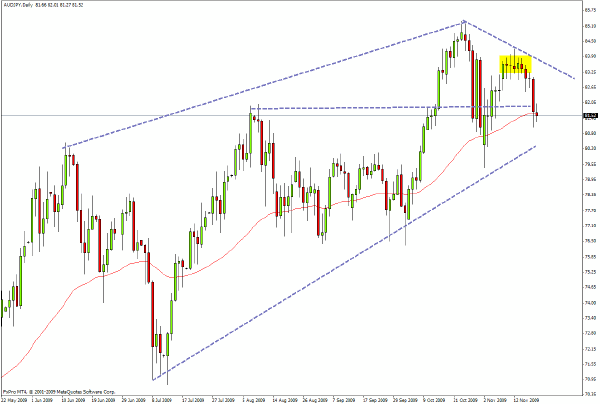
AUD/JPY, as seen on the daily chart below, failed to find support at the key level at 8190 discussed yesterday and is currently straddling the 50-period EMA.
The 8040 area is now a likely test for this cross rate and, if this should hold, this will likely be taken by those favoring the resumption of normal service of the carry trade as a positive indicator for equities as we move through the festive season.
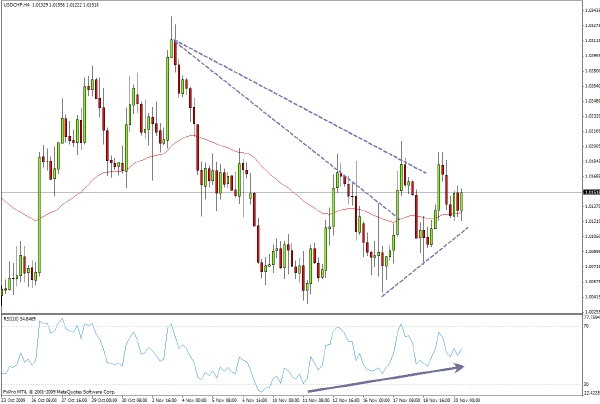
USD/CHF, which is largely influenced by the relative positioning of the Swiss currency vis-a-vis the euro, is showing a very gradual continuation of the basing pattern I have drawn attention to for some time. The chart shows that a fan-like pattern from the recent high has been penetrated twice and the underlying momentum as reflected in the RSI chart is showing some positive divergences.
This pair would be worthy of a punt on the long side if the US dollar can break above the 1.02 level against the Swiss Franc. If the move is sustainable this would also be further validation that the euro may have seen an intermediate topping against the dollar. But play this market carefully as the US/Swiss is one of the harder currency pairs to trade.
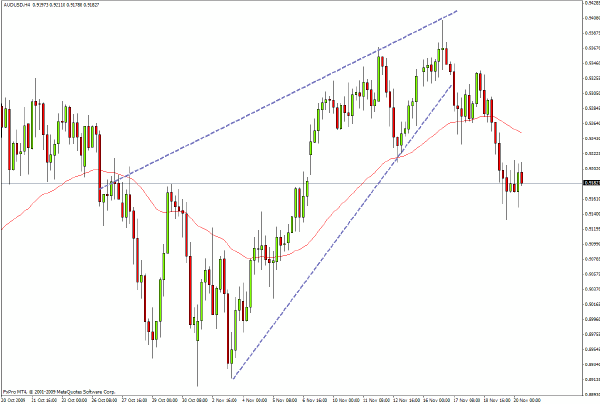
I have already discussed the AUD/JPY rate but the AUD/USD rate is also useful as a means of monitoring the likely direction of the US dollar in the near term, partly as the dollar has become the most widely used funding currency in the carry trade. The evidence of a breakdown from a clear rising wedge formation shows that the current level is at the the top of the most obvious point of the wedge formation, but a test of the lower level of the wedge origination level must also be a consideration. Needless to say, if the Aussie dollar slips to that level against the US currency and the Japanese yen continues to exhibit relative strength, the previously discussed AUD/JPY cross rate chart will look a lot more troublesome.
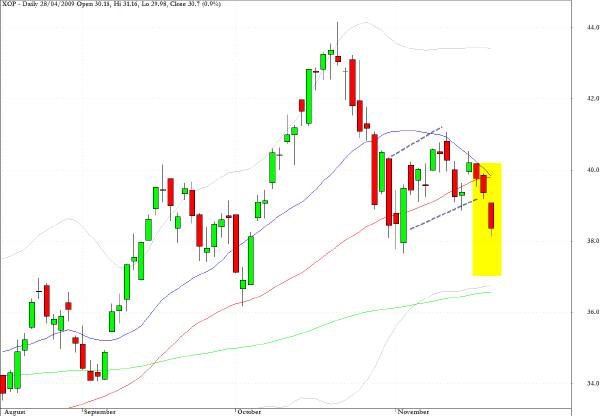
Here are my comments from a week ago on XOP.
There is a fairly well-defined bear flag with the appropriate volume characteristics for XOP, an ETF which tracks the energy exploration sector.
Clive Corcoran is the publisher of TradeWithForm.com, which provides daily analysis and commentary on the US stock market.
|