| The McMillan Options Strategist Weekly |
| By Lawrence G. McMillan |
Published
11/20/2009
|
Options
|
Unrated
|
|
|
|
The McMillan Options Strategist Weekly
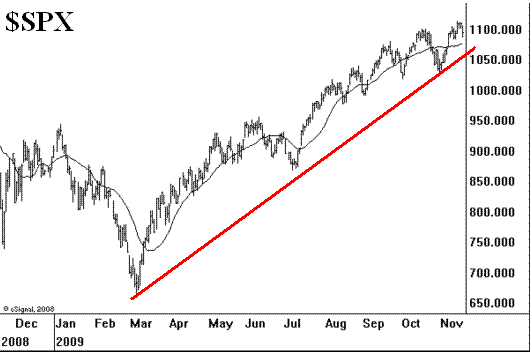
The positive news was that $SPX broke out over 1100 last Monday, convincingly moving well above that resistance level, and doing so with strong volume (a 90% up volume day). The negative news is that the breakout is in jeopardy of becoming a false one. Near-term support exists at 1080-1085.
From an intermediate-term point of view, the $SPX chart remains bullish because the uptrend line connecting the major lows is intact and still rising. Furthermore, the series of higher lows is still intact.

Market breadth has given another sell signal -- the third one since November 10. These repeated sell signals are a sign of the deterioration in the overall market. These sorts of things can persist as tops are "rounding" affairs.

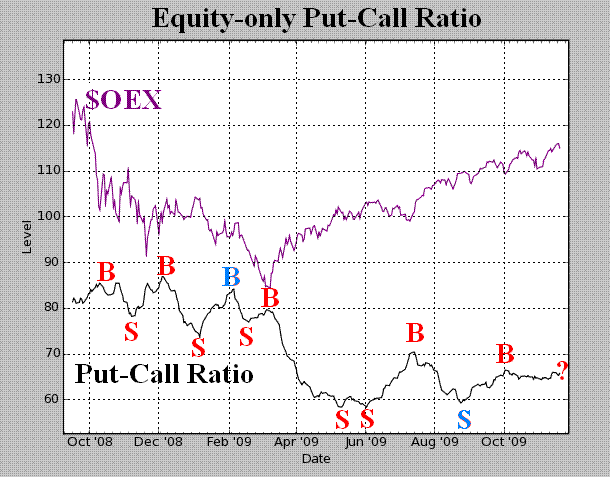
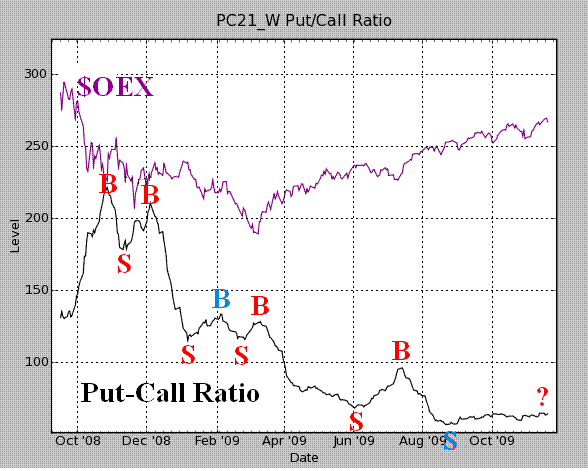
The equity-only put-call ratios have still not completely shaken off the effects of the massive put hedging purchases that have taken place since July, 2009. These ratios have remained in very tight ranges over the past couple of months.

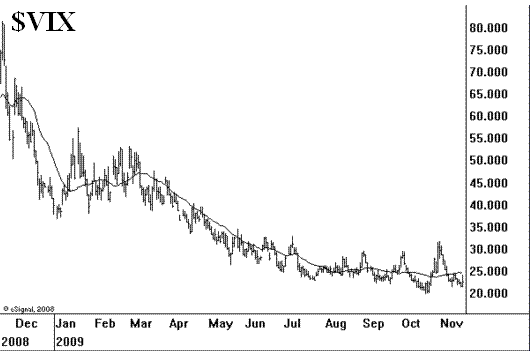
Volatility indices, however, are still quite low. Thus, the trend of volatiltiy remains downward and that is bullish. Even with today's rather sharp selloff, $VIX was only slightly higher.

In summary, the $SPX chart is intermediate-term bullish as are the volatility indicators, but a close below 1080 would be short-term negative -- likely signaling the next correction, as confirmed by the sell signals in the breadth oscillators.
Lawrence G. McMillan is the author of two best selling books on options, including Options as a Strategic Investment, recognized as essential resources for any serious option trader's library.
|