| Corcoran Technical Trading Patterns For November 23 |
| By Clive Corcoran |
Published
11/22/2009
|
Stocks
|
Unrated
|
|
|
|
Corcoran Technical Trading Patterns For November 23
In this holiday-shortened week there will be a renewed focus on the plight of the dollar, which once again in Asian/European trading on Monday seems to be doing what it does best which is to continue to slide against all major currencies.
European equities are off to a good start and the Hang Seng managed to register a 1.4% gain, although the Nikkei 225 slid back another 0.5% and closed below the 9500 level. Despite the negative outlook on the Japanese benchmark index, which I discussed on CNBC’s European Closing Bell last Friday, it would not be surprising to see a rally back towards the 10,000 level but the performance of the yen could play against this scenario as it is showing signs of being quite comfortably placed below the 90 level against the US dollar.
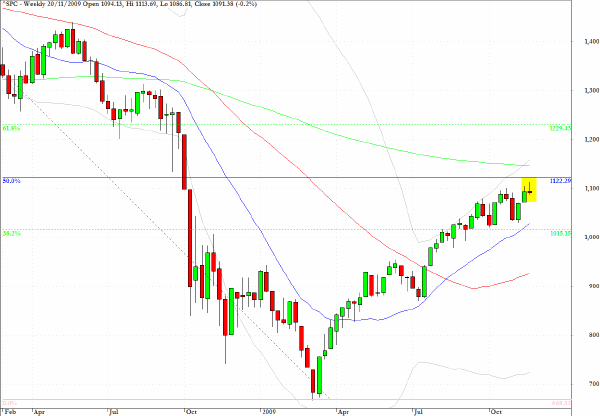
The S&P 500 weekly chart reveals an interesting candlestick formation, which at a bit of a stretch, could be likened to a gravestone doji pattern and in common with other US indices shown below there has been a notable inability to penetrate (so far) the 200-week EMA (the green line on the chart).
The seasonal characteristics are in favor of equities, and, if the dollar doesn’t surprise this week, a test of 1120 on the S&P 500 will be a target for the bulls.
This will be my only commentary this week, as I have other commitments over the next few days, and I would like to take this opportunity to wish a very happy Thanksgiving to all of my American readers.
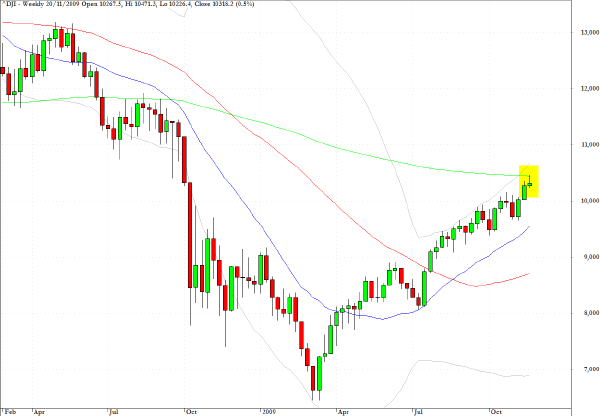
Remarkably, the weekly chart for the Dow Jones Industrial Average (DJIA) reveals another shooting star/doji formation at exactly the 200-week EMA as just observed above.
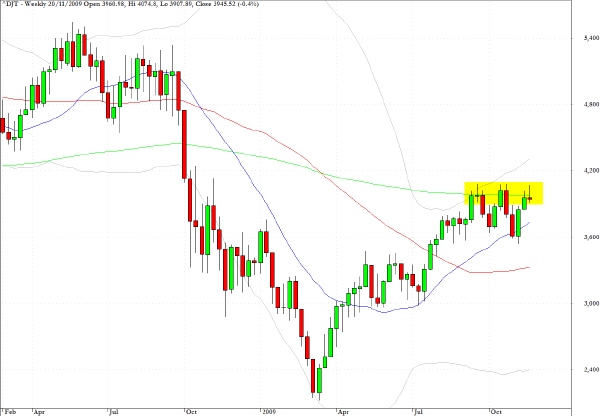
The Dow Jones Transportation (DJT) reveals several candlesticks with upper shadows which have pierced the 200-week EMA but so far this index has been unable to remain above this key technical indicator.
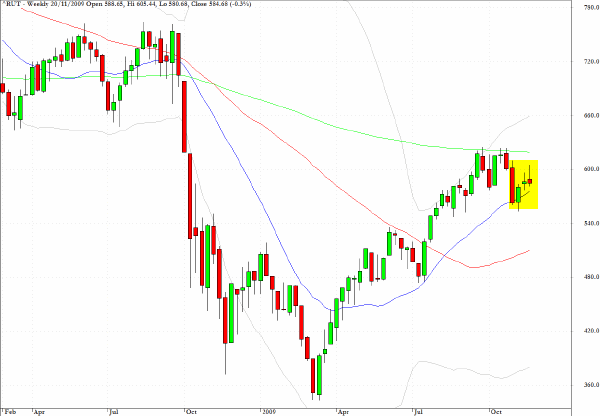
The weekly chart for the Russell 2000 (RUT) displays a slightly different picture in that the failure to cross above the 200-week EMA produced the elongated red candlestick formation from four weeks ago and the subsequent three weekly closes, in a pullback channel, are indicating that this index could be losing contention with the challenge reflecting the gradual diminution in risk appetite among US institutional fund managers.
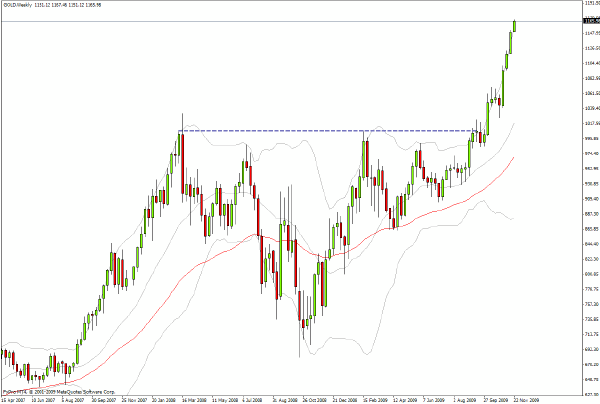
Regular readers of the Daily Form may recall my commentary from October 6 in which I devoted the whole analysis to gold. This turned out to be the very day that the metal began its break above the inverse head and shoulders pattern which was examined in some technical detail in that day’s commentary.
By way of update, the metal is breaking to new highs in Monday trading above $1165 per ounce and I would suggest that based on the diagnosis of the H&S pattern the metal could easily be ready to add another $150 per ounce in the longer term. This is an outright bull market, and any significant pullbacks, which might well emerge in coming sessions, will almost certainly be seen as buying opportunities by those who have been sceptically sitting on the sidelines so far.
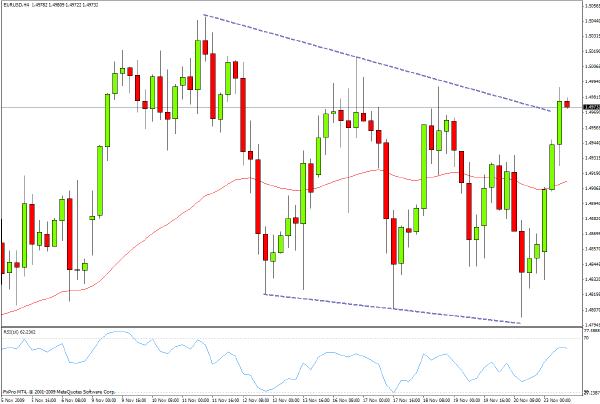
Time did not permit a discussion of the EUR/USD currency pair during my slot on CNBC Europe on Friday, but the pattern as seen below on the 4-hour chart shows that the eurozone currency is now moving within a well-defined range between about $1.50 and $1.48. The break above the upward range in Asian trading on Monday should be monitored during the course of today’s North American session, as the remainder of the pattern is suggesting that a downward channel is emerging. A decisive break below $1.48 would trigger a lot of sell stops, but equally and especially with the North American market taking a break for Thanksgiving later this week and the accompanying drop in FX liquidity, a break above $1.5050 could see a rather sharp rally.
This is a key market to monitor this week and if the US dollar is to develop any positive momentum, the break below $1.48 would be the signal that other rates will begin to become dollar-supportive as well.
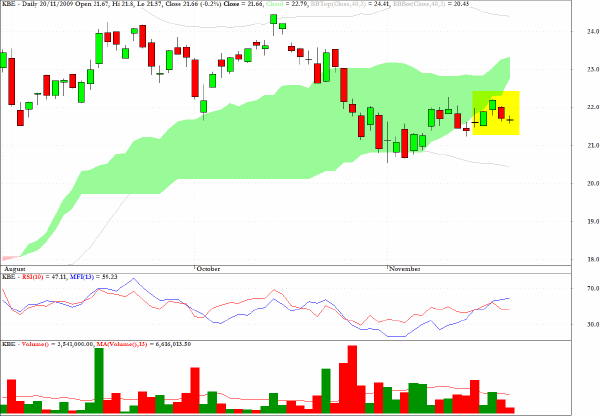
KBE, which is the exchange traded tracker of the KBW Banking Index, remains below the green cloud and the sector seems to be lacking an impetus to move it higher.
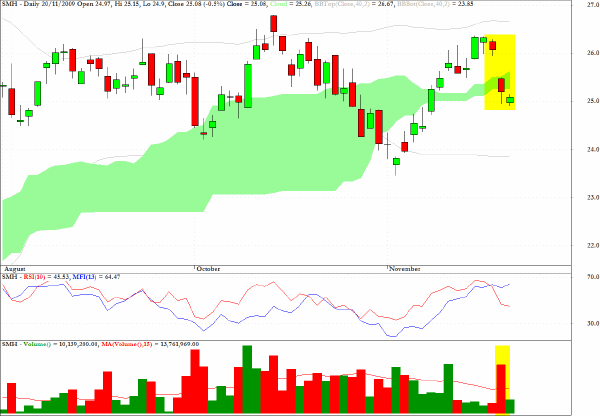
SMH, an ETF which tracks the semiconductor sector, is one other sector which is trading below the adjacent Ichimoku cloud formation.
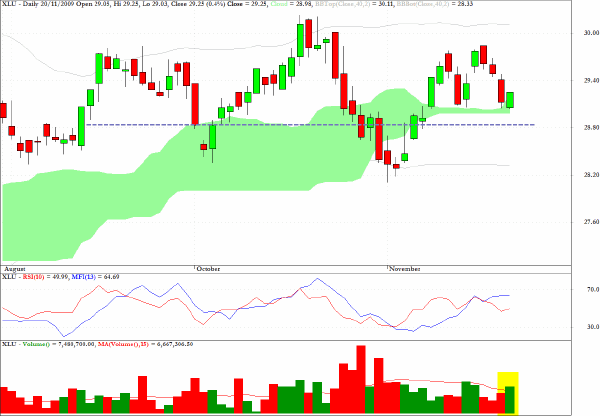
XLU, which tracks the utilities sector, may have found some short-term support as it touched the base of the Ichimoku cloud pattern in Friday’s session and there is also a chart support/resistance line in the vicinity
Quite frequently the patterns about which I comment take a day or two before the anticipated outcome occurs(of course, there are those where the alternative outcome occurs as well!).
The chart for TUR, an exchange traded fund which reflects the Turkish equity market, has sold off quite significantly since the date of recommendation, despite making an upward move on the day it was discussed, which is indicated by the vertical blue line through the chart.
1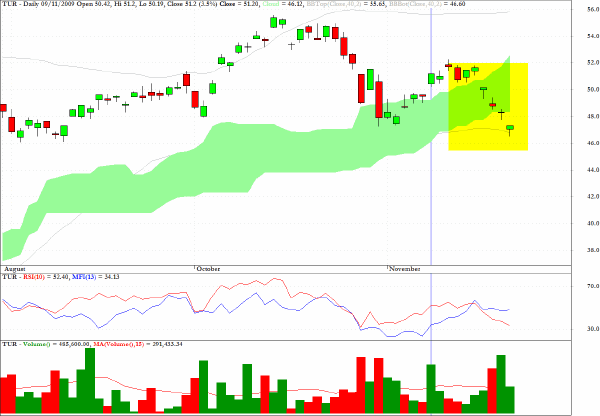
Clive Corcoran is the publisher of TradeWithForm.com, which provides daily analysis and commentary on the US stock market.
|