| Corcoran Technical Trading Patterns For November 30 |
| By Clive Corcoran |
Published
11/30/2009
|
Stocks
|
Unrated
|
|
|
|
Corcoran Technical Trading Patterns For November 30
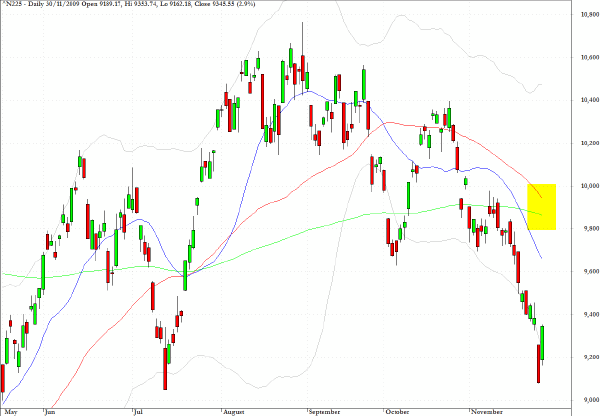
In last Monday’s commentary I pointed to the potential for a test of the 9000 level on the Nikkei 225 and on Friday we came within about 70 points of such a test. The fan-like formation which I have demonstrated on the Japanese chart reveals that the baseline of the fan has held in Monday’s session with a 2.9% recovery.
The area highlighted on the chart indicates that there is now a distinct possibility that the 50-day EMA will perform the converse of the golden crossover as it appears to be headed below the 200-day EMA from above.
The strength of the Japanese yen during last week’s anxieties about the troubles facing Dubai also re-invigorated the notion that during flights to safety the yen is ultimately one of the most sought after safe haven currencies. It also is causing concern at the BOJ as the second largest economy relies upon a competitive currency (especially with respect to the renminbi which is pegged to the US dollar) to maintain the level of exports which will allow Japan to counter the deflationary forces and deteriorating public finances.
It will be worth monitoring the USD/JPY cross rate this week as there could be BOJ interventions, and other cross rates involving the JPY are likely to behave erratically if such intervention is implemented decisively.
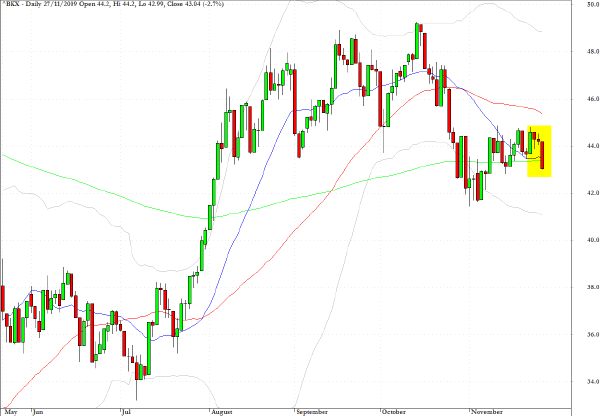
The KBW Banking Index (BKX) has now dropped below all three key moving averages and as with the Nikkei chart there is the potential for the 50-day EMA to drop below the 200-day EMA which would present a more negative tone to this key component of the US equity market.
As I was absent for most of last week, I was not able to comment on the consequences of the Dubai World announcements on the FX markets. The risk aversion triggered by the most absurdly mis-timed and extravagant real estate adventure in modern history, and which will almost certainly persist and raise questions about the integrity of several emerging market ventures, showed that the two safe haven currencies, JPY and the Swiss Franc (CHF), were the primary beneficiaries of the flight to safety.
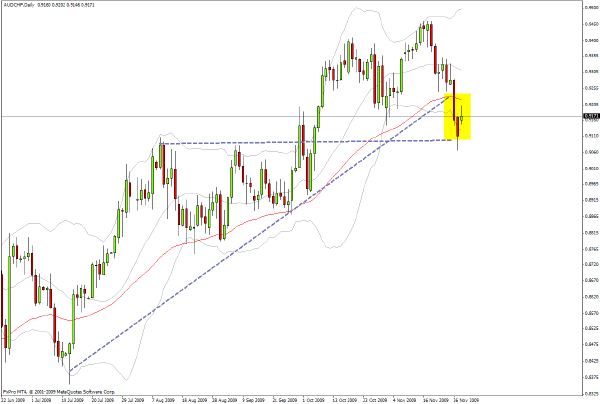
The strength of the Swiss currency also brought back into the frame the usefulness of tracking AUD/CHF as one of the carry trade pairs which needs to be monitored closely for signs that the unwinding process may be gathering momentum.
As the chart below reveals, a key trend line was broken late last week and another test of last Thursday’s low is to be expected. Should that low fail to provide support, the exit out of the Australian dollar could be quite ugly and produce chasms of illiquidity in forex trading which would impact significantly on the P&L’s of those large players, who have enjoyed some great months of exploiting dollar weakness, loading up on forex carry trade pairs, and enjoying exciting returns in commodities and emerging markets.
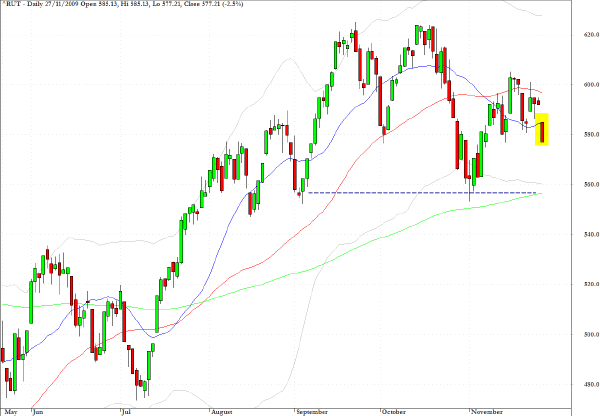
The daily chart for Russell 2000 (RUT) is still presenting the view that the appetite for the smaller cap and higher beta stocks is in retreat, and once again the 550 level seems to be an attractor level which needs to be tested.
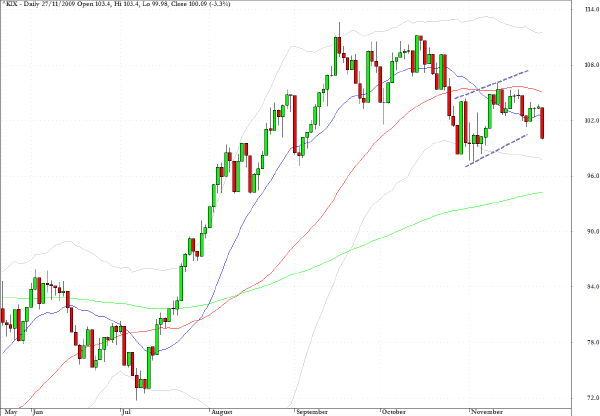
The Insurance Index (KIX) is dropping from a bearish pullback pattern and could be heading for a test of the 200-day EMA at the 95 level.
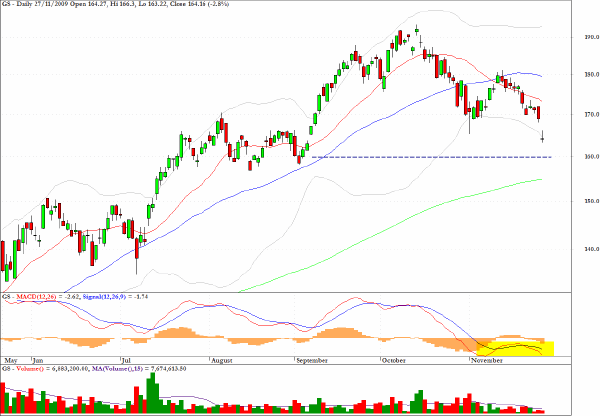
Recent movement in Goldman Sachs (GS) has validated the weak MFI readings that have been present for some time. The $160 area should provide a potential support area and the MACD chart suggests that there could be a tradable rally back towards $180.
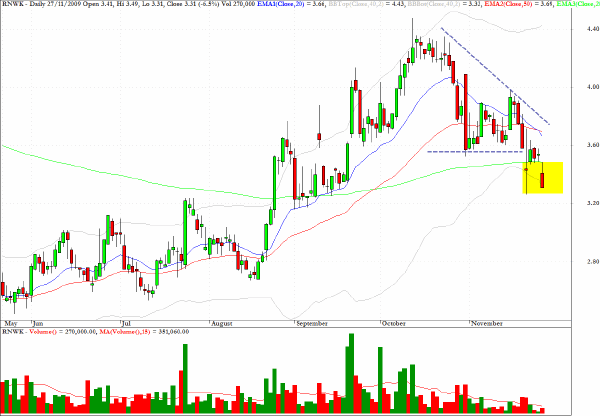
The chart for Real Networks (RNWK) shows a decisive and bearish looking pattern as it has dropped out of a clear descending wedge pattern. A re-test of the August lows seems to be an intermediate term probability.
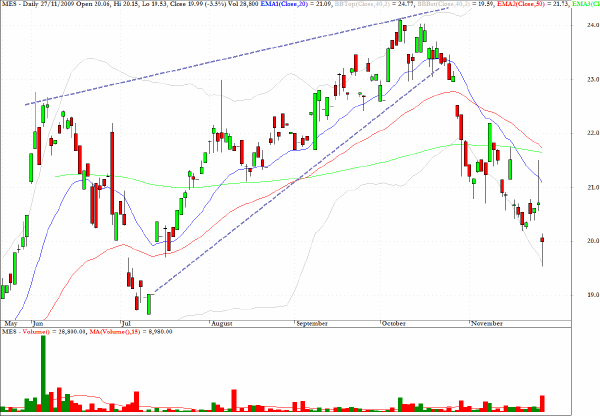
In Monday’s trading the Dubai and Abu Dhabi exchanges are seeing drops of seven percent and more. There is an ETF which provides exposure to the UAE and Gulf States, MES, and the violation of the rising wedge pattern revealed would have provided clues that the region was vulnerable to a substantial correction.
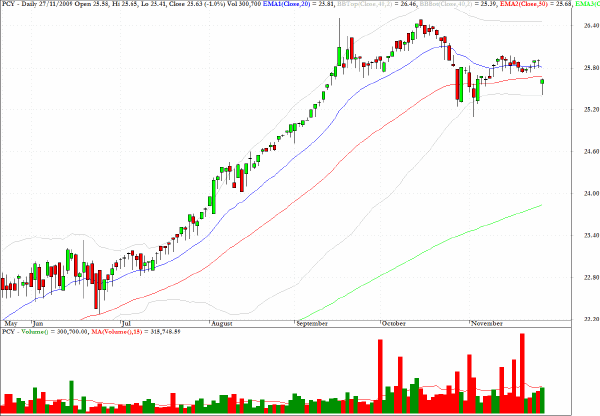
One other sector fund which would be worth monitoring is PCY which is a play on the sovereign debt of emerging markets. Recently the fund has seen some large volume days associated with a pullback channel and the close below the 50-day EMA on Friday and the clear violation of the uptrend line in place since June suggests that this sector could be vulnerable as the more adventurous funds have second thoughts about the risks associated with the emerging market debt and the possibility of significant haircuts for holders of these "exotic" securities.
Clive Corcoran is the publisher of TradeWithForm.com, which provides daily analysis and commentary on the US stock market.
|