| Corcoran Technical Trading Patterns For December 1 |
| By Clive Corcoran |
Published
12/1/2009
|
Stocks
|
Unrated
|
|
|
|
Corcoran Technical Trading Patterns For December 1
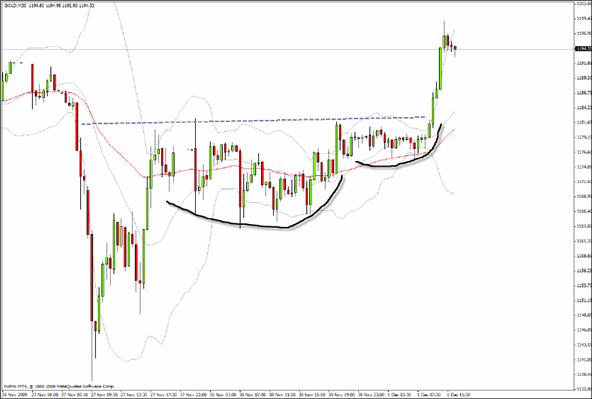
In European trading on Tuesday, spot gold has come within a whisker of the $1200 level and the pattern indicated below on the 30-minute chart reveals again the cup/handle formation, discussed here in depth on October 6, which shows that there are still plenty of disbelievers who, when they run to cover short positions, will help to maintain the upward momentum in this market.
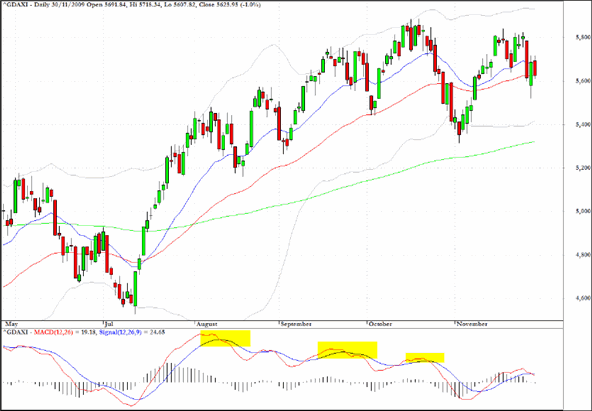
Germany’s DAX index is displaying momentum divergences and what, at least at present, appears to be a failed double top pattern. Perhaps with plenty of festive cheer this anomaly can be corrected, but among the major European indices this index has a less bullish tone than, for example, the FTSE which is heavily exposed to mining and commodity-based stocks, for which there is still plenty of risk appetite.
For a slightly more cautious view on the UK, it is no longer just mavericks that are sounding out the possibility that the UK could face a sovereign debt crisis but Morgan Stanley has issued a note to that effect as well. Details can be found at my blogsite.
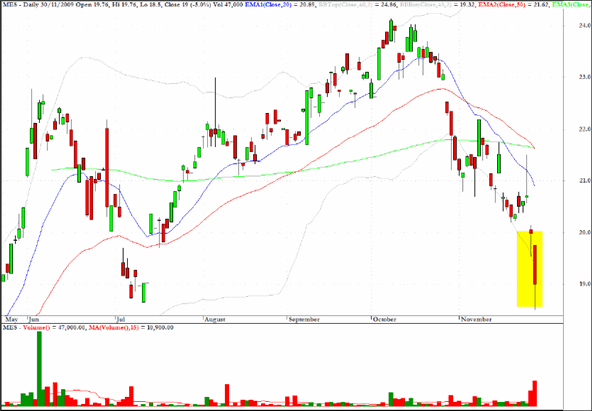
The exchange traded fund which allows exposure to the economies of the Gulf States, MES, which was featured here yesterday, would have provided a relatively easy three or four percent reward on the downside yesterday.
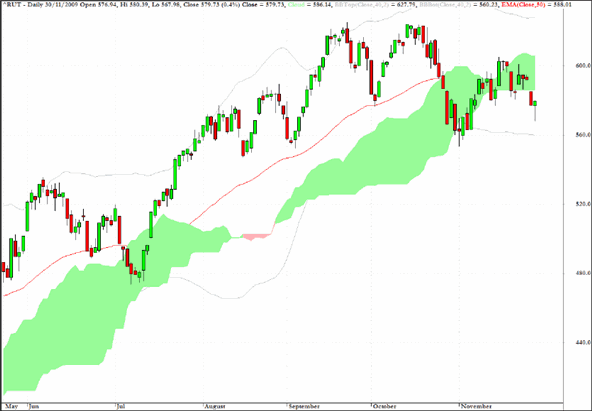
The Russell 2000 (RUT) chart is the only major index in the US to be positioned below cloud support.
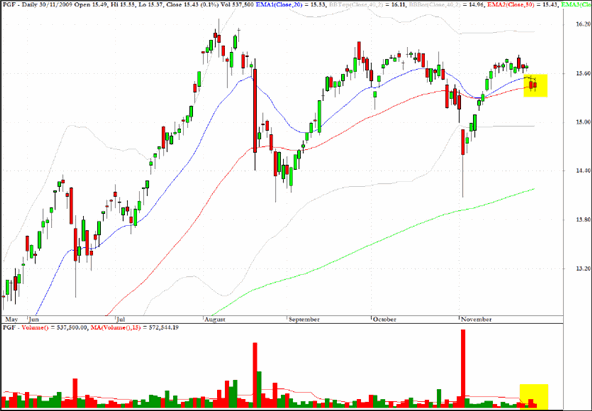
PGF is a sector fund which tracks the price and yield performance of the Wachovia Hybrid & Preferred Securities Financial Index, and recent price action suggests that an extended pullback from heavy volume selling in early November may have run its course.
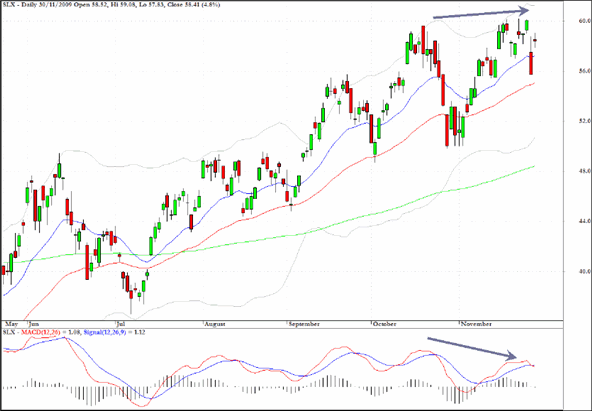
The steel sector fund, SLX, looks vulnerable with a clearly defined upward sloping price/downward sloping MACD divergence.
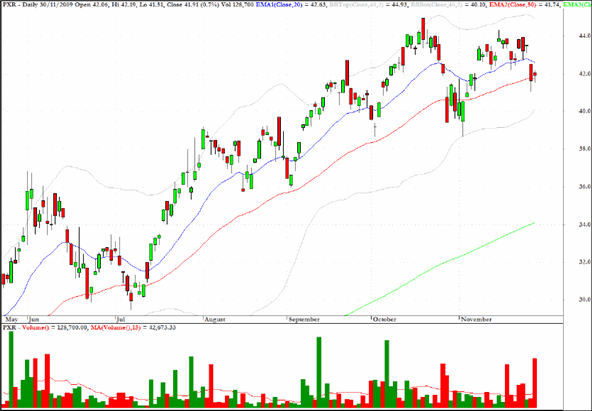
One further ETF which is worthy of consideration as the twists and turns unfold in the Dubai World saga is PXR which tracks emerging market infrastructure investments, and which is revealing evidence of a possible double top failure.
Clive Corcoran is the publisher of TradeWithForm.com, which provides daily analysis and commentary on the US stock market.
|