| Corcoran Technical Trading Patterns For December 3 |
| By Clive Corcoran |
Published
12/3/2009
|
Stocks
|
Unrated
|
|
|
|
Corcoran Technical Trading Patterns For December 3
I shall be reviewing some strategic levels for key asset classes during a technical analysis slot this afternoon on CNBC’s European Closing Bell at about 16:30 London time.
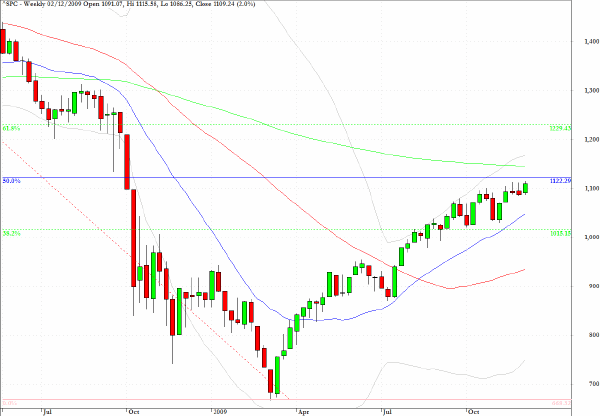
The weekly chart of the S&P 500 reveals three key thresholds that this index faces in terms of future upward progress. The first is the 1122 level which represents the 50% retracement of the historic high and the March intraday low of 666. The index is within one percent of that level and one must presume that this will be tested imminently.
After that the index faces the 200-week EMA which at present is around the 1140 level which is a hurdle currently being confronted by several global indices including the Dow Jones Industrials and Germany’s DAX.
The next target, assuming that these hurdles will be overcome, will be the 62% retracement level at 1230.
My tentative conjecture is that, assuming the dollar continues to cooperate by muddling along at or below current levels, we could see 1230 on this index within the next couple of months. If the forex carry trades, which are looking a little toppish, should start unwinding, then the index may have some choppy trading which could potentially result in a re-testing of the 1000 area again.
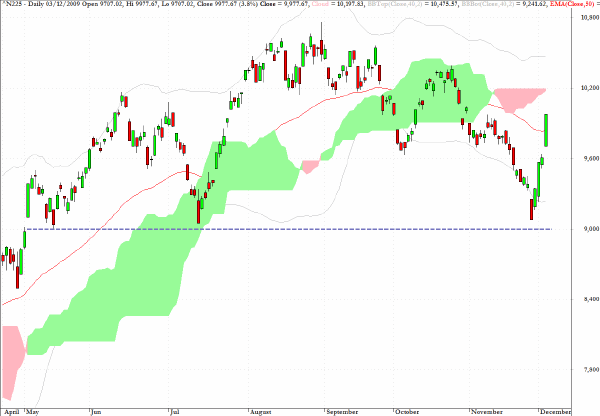
The Nikkei 225 has made a startling recovery in the last few sessions. After reaching down almost to the 9000 level last Thursday, which was discussed here during November, the index has surged back to almost the 10,000 level - including a 3.8% trend day in Thursday’s session. The index opened on its low and closed on its high for the session.
The Japanese central bank and policy makers are clearly acutely aware of the critical nature of the 9000 level. As drawn on the chart violation of this clear baseline (dare one say neckline) could have turned the recent weakness into a rout. The very swift recovery echoes that seen the last time the index reached down to 9000, and as can be seen the index now needs to indicate that it will not plateau and begin the formation of a potential right shoulder where the baseline could again be tested in coming weeks.
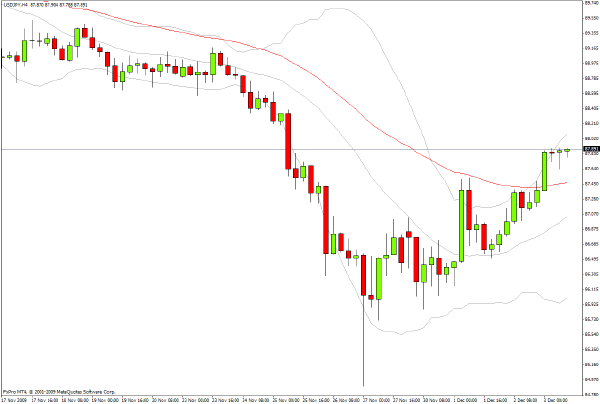
The 4-hour chart for the USD/JPY shows that the recent bout of yen strength - coinciding with Dubai-centered flight to safety - may be ready to yield to a strengthening of the dollar at least in regard to this currency pair. The measures being taken by the BOJ to stimulate the Japanese economy, with even looser monetary policy than hitherto (which has a slight quality of desperation attached to it) may not assist in the overall desire to see the yen weaken. At least if there is a firmer tone to Japanese equities (for a while at least) there may be less re-patriation by Japanese investors and some positive foreign capital inflows.
The public finances in Japan are some of the worst within the G20 and there is still a large concern about the willingness of foreigners to keep buying JGB’s with coupons of around 1.5%.
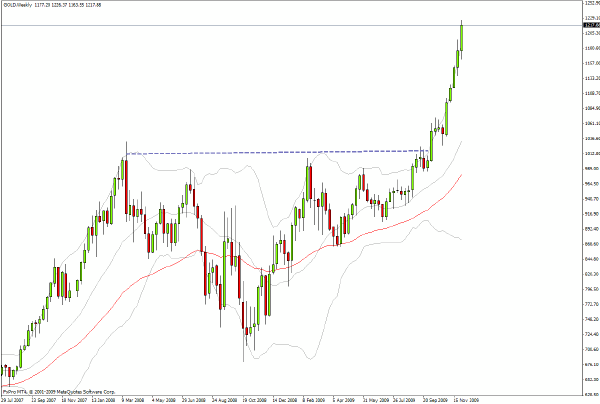
Gold continues to surge ahead, and while there is a clear possibility of a temporary setback I shall repeat the forecast made here on October 6 - that based upon the inverted head and shoulders pattern seen most clearly on the weekly chart - the initial technical target for this formation is around $1350 per ounce.
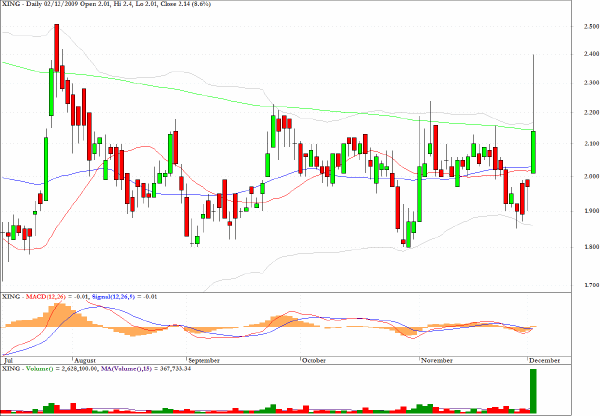
Sometimes suggestions made here take a while to materialize. Here are my comments from a couple of weeks ago.
XING is in a tight range but the MFI and volume charts are suggesting that an upward breakout could arise in coming sessions.
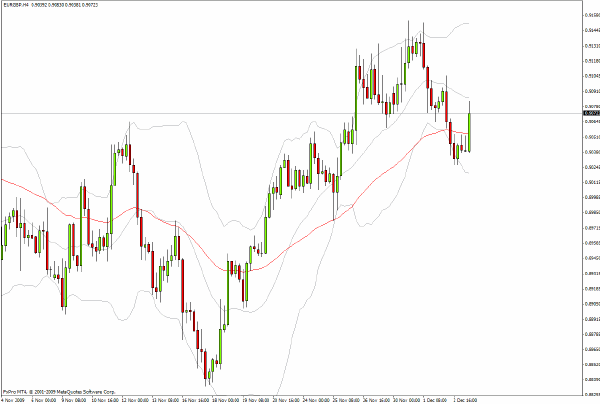
As anticipated here yesterday EUR/GBP turned out to be at an inflection point and a long position taken up in yesterday’s afternoon session could have delivered at least 70 pips, and I suspect that sterling could weaken further putting a re-test of the recent highs on this cross rate back in play.
Clive Corcoran is the publisher of TradeWithForm.com, which provides daily analysis and commentary on the US stock market.
|