| Corcoran Technical Trading Patterns For December 7 |
| By Clive Corcoran |
Published
12/6/2009
|
Stocks
|
Unrated
|
|
|
|
Corcoran Technical Trading Patterns For December 7
Friday’s remarkably strong NFP data caused a fair amount of consternation for asset allocation strategists. The most obvious beneficiary was the dollar on the belief that the days of easy money may be numbered. On this I would suggest (as I did in commentary elsewhere this weekend) that
Friday’s data may require some "quant" funds to re-calibrate their correlation assumptions in the forex carry trade, but Australian interest rates are going to outpace by a long way any changes from the Fed, and emerging economies such as India and Brazil are facing inflationary issues which will still encourage hot money flows into more exotic assets rather than the US economy which still faces strong headwinds.
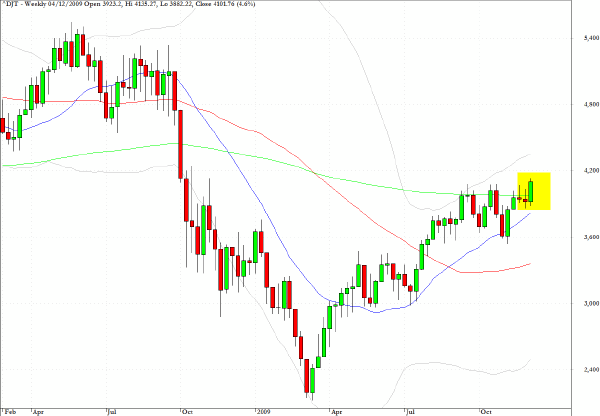
For those favoring further bullish action in US equities there were two positive developments. First, as the weekly chart for the Dow Jones Transportation Average (DJT) reveals, the index broke to a new recovery high last week and has moved above the 200-week EMA.
Also the behavior of the Russell 2000 was more encouraging - from a divergence perspective - than suggestive that there will be an exodus from equities if the US dollar continues to strengthen. My advice would be to monitor IWM, from both a price and volume perspective during this coming week.
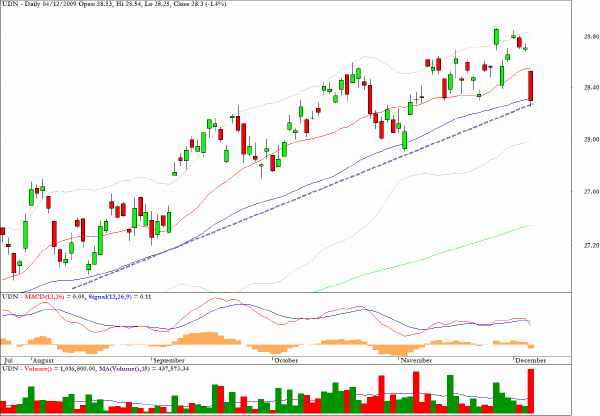
UDN, which allows one to take a long position in an ETF which will profit from a fall in the dollar looks about to drop below a key trend line. Alternatively one could derive similar benefits from UUP which will also deliver profits from a strengthening greenback.
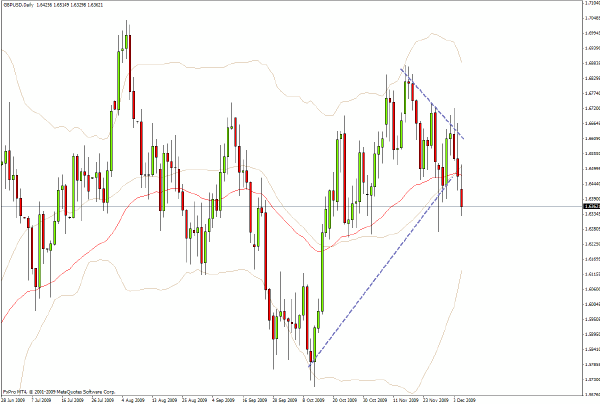
The FX pair which I shall be watching closely this week is GBP/USD which looks ready to drop towards the $1.62 area and special focus will come on sterling this week as the UK Chancellor delivers what is widely expected to be some rather unpleasant details about the deterioration of the public finances.
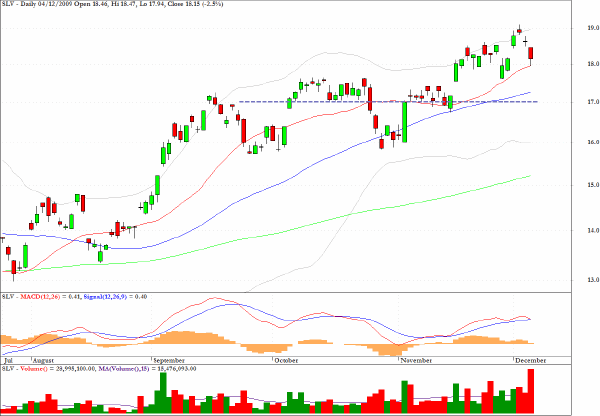
The exchange traded fund which tracks the spot price of silver looks vulnerable to a setback towards the $17 level.
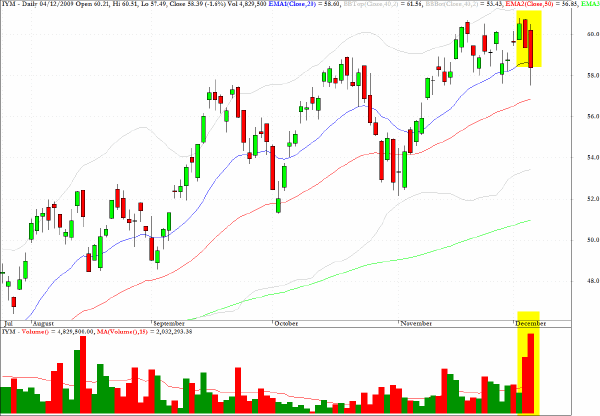
Basic materials stocks were hit late last week as the chart for IYM indicates and especially noteworthy is the substantial volume which arose in Friday’s session. An eventual retreat towards the $54 level, possibly following a short term pullback, would seem likely.
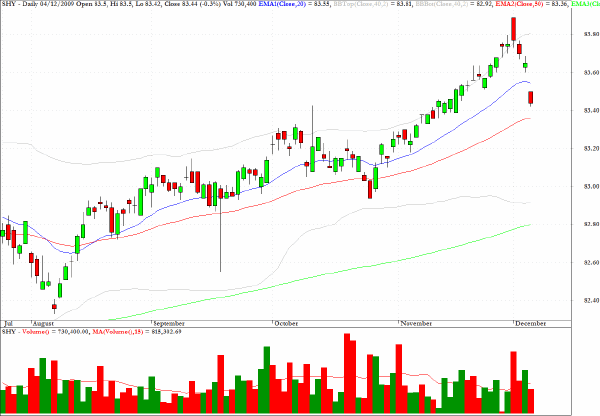
SHY, an exchange traded fund which reflects the Lehman index of 1-3 year Treasury bonds, has registered successive sharp drops suggesting that yield curve expectations are being re-thought as more traders are seeing evidence of some underlying traction in the US economy.
Long term, I believe the long end of the Treasury curve will be the most vulnerable to price attrition, but in the near term most of the action will likely be seen in a narrowing of the Treasury 2/10 year spread, and this trade can be implemented using ETF instruments.
Clive Corcoran is the publisher of TradeWithForm.com, which provides daily analysis and commentary on the US stock market.
|