| The Wagner Daily ETF Report For December 8 |
| By Deron Wagner |
Published
12/8/2009
|
Stocks
|
Unrated
|
|
|
|
The Wagner Daily ETF Report For December 8
Stocks pushed higher during the first half hour of trading, but that was all the bulls could muster, as broad market averages drifted sideways most of the day before selling off to new intraday lows in the final two hours of trading. We are beginning to see a pattern of weak rally attempts in the morning session followed by afternoon selling, as the bulls are unable to sustain momentum intraday. The small-cap Russell 2000 and Dow held on to finish positive, up 0.13% and 0.01% respectively. The S&P Midcap 400 shed just -0.1%, while the S&P 500 gave back -0.3%. The Nasdaq Composite dropped -0.2%, but the Nasdaq 100 showed relative weakness by closing down -0.5%.
Total volume was well off the pace of Friday's big volume reversal day in both indices, which isn't much of a surprise given the day's fairly tight trading range. NYSE volume dropped 31%, while Nasdaq volume was 16% lower. Market internals were neutral, as advancing volume vs. declining volume was slightly negative on the NYSE and on par in the Nasdaq.
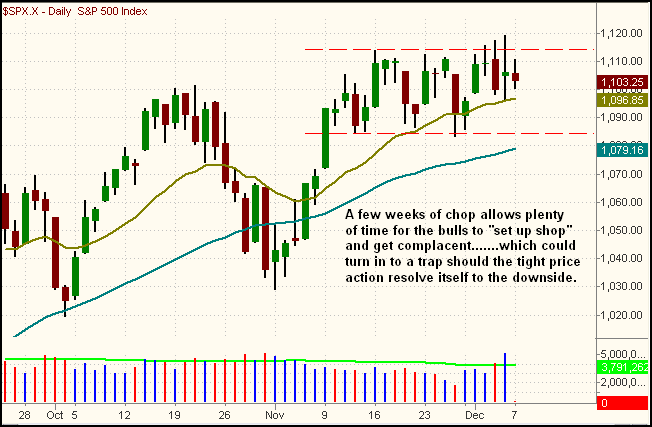
The range-bound chop continues:

The action is pretty obvious in the S&P 500.....the longer this market chops around, the more explosive the move out in either direction will be.
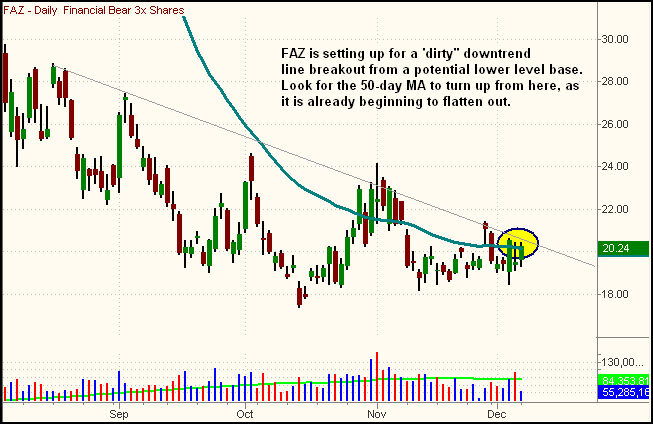
Playing both sides of the market isn't a bad idea here, so we are still monitoring a pullback long setup in Semiconductor HOLDR (SMH) while our short positions in OIH and RKH are in the money. If the financial sector continues to weaken, then we could see a downtrend line breakout develop in the Financial Bears 3x (FAZ) chart below:

Short-term traders may wish to buy the break of downtrend line in this inverted ETF to gain some short exposure. Intermediate-term traders may want to stay on the sideline until the 50-day MA begins to slope upward, and there is a clear breakout from a lower level base.
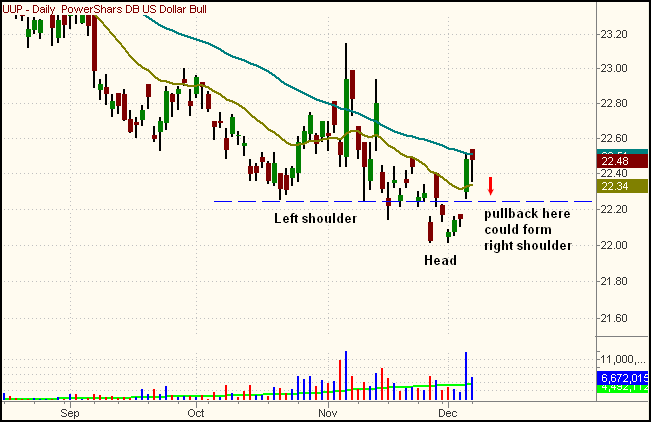
Should the U.S. Dollar Bull Index (UUP) fail to attract momentum from a breakout above the 50-day MA, then we could see a pullback to the 22.25 area, which would give the pattern a potential inverted head and shoulders bottoming look:

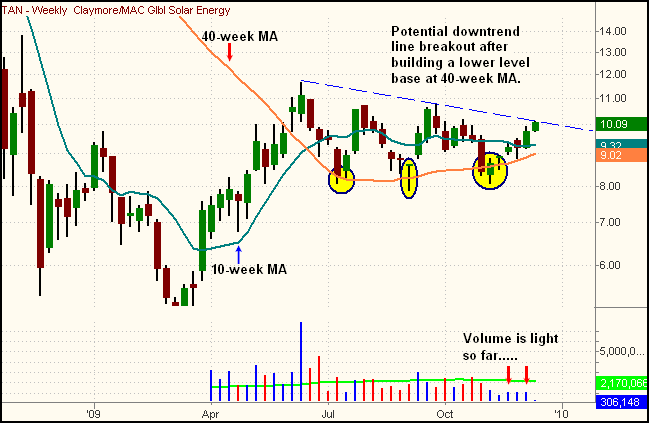
In addition to the long setups we mentioned in yesterday's report (SMH and IYT), we also see a potential downtrend line breakout in Claymore/MAC Global Solar Energy (TAN). The weekly chart below illustrates the lower level basing action that has formed off support of the 40-week MA, which is about the same as a 200-day MA on a daily chart. This is just a setup to watch for now, as the light volume has yet to confirm the price action.

Open ETF positions:
Long - IBB
Short (including inversely correlated "short ETFs") - OIH, RKH
Deron Wagner is the Founder and Head Trader of both Morpheus Capital LP, a U.S. hedge fund, and MorpheusTrading.com, a trader education firm.
|