| Corcoran Technical Trading Patterns For December 10 |
| By Clive Corcoran |
Published
12/10/2009
|
Stocks
|
Unrated
|
|
|
|
Corcoran Technical Trading Patterns For December 10
Equity markets continue to remain a captive to the risk appetite/weak dollar versus risk aversion/dollar strength dichotomy. In European trading, the US currency seems not to be attracting a firm bid and to that extent I would suggest that the most likely direction for US equities today is upwards.
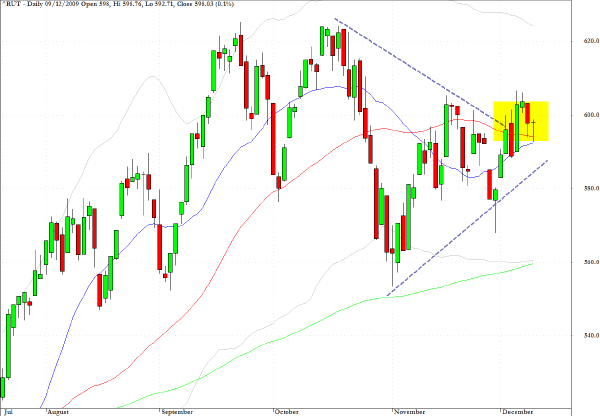
The Russell 2000 chart has been slowly transforming into a more positive formation in recent sessions, and this would suggest that a seasonal rally could be rewarding to the small cap stocks.
On a longer-term outlook, I would look to be exiting this section of the market on a rally back towards the mid-October highs.
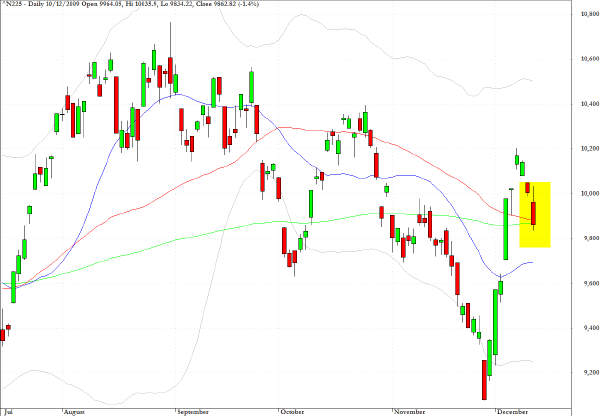
The Nikkei 225, despite a surge from the 9000 level just two weeks ago, is giving back some gains and notably failed to close above the 10,000 level in Asian trading on Thursday. More importantly, as anticipated in comments here recently, the 50-day EMA is poised to cross the 200-day from EMA above if the slippage continues.
This remains the most vulnerable major global index in my opinion.
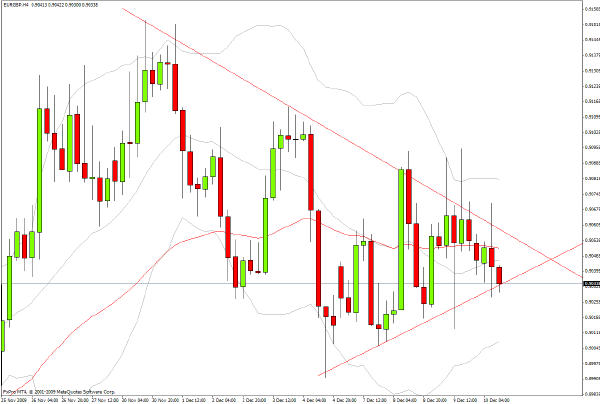
EUR/GBP cross rate is also at a key level and is moving further into the apex of a triangular formation on the four-hour chart which suggests that a decisive directional breakout is imminent.
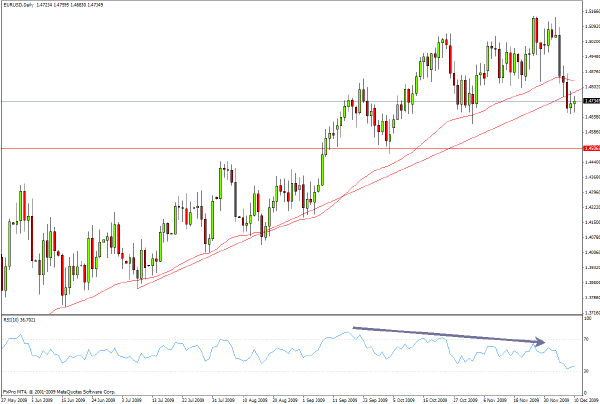
As my comments below indicate, I believe that the euro has put in an intermediate-term top and the key to the EUR/GBP pair now is the manner in which sterling behaves relative to the US currency. The technicals are not really clear in terms of which way this breakout might go and the fundamentals are even more confusing, especially with Greece being downgraded to BBB+ and Spain on negative watch on the one hand, and the UK’s PBR being an exercise not in Austrian economics but Ostrich economics.
Based on the chart formations, the euro will struggle to regain a footing above $1.4850 and I would not be surprised to see $1.47 broken in coming sessions which would then open up a sharper drop to the $1.45 level where a rebound rally should be expected.
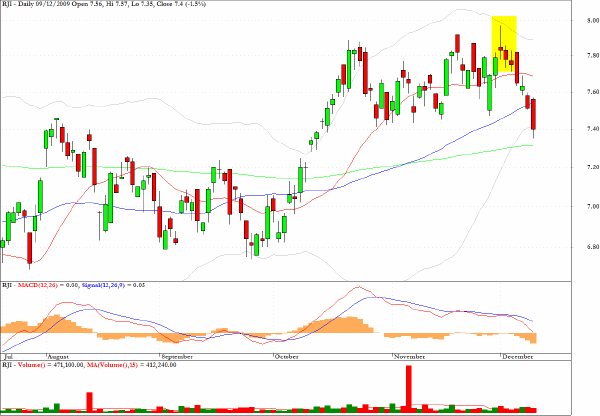
As a followup to two charts mentioned in this commentary recently, RJI, which is an exchange traded fund which tracks the Rogers Commodity Index, has sold off sharply as anticipated following the candlestick pattern highlighted on the chart. Support may now be provided by the 200-day EMA.
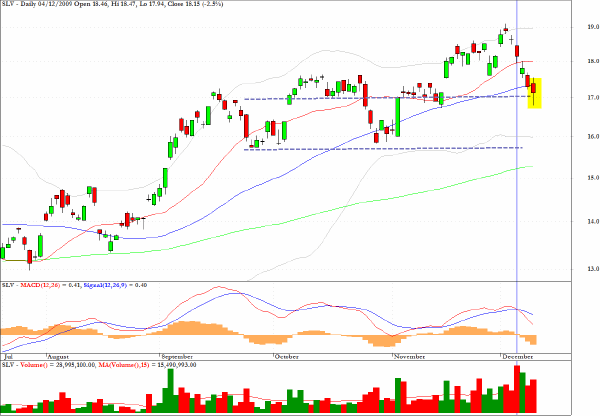
Also, as anticipated here in Monday’s column, SLV broke down below the $17 level in yesterday’s session and should eventually (but not necessarily in a hurry) retest the $15.80 level.
Clive Corcoran is the publisher of TradeWithForm.com, which provides daily analysis and commentary on the US stock market.
|