| Corcoran Technical Trading Patterns For December 11 |
| By Clive Corcoran |
Published
12/10/2009
|
Stocks
|
Unrated
|
|
|
|
Corcoran Technical Trading Patterns For December 11
Yield on the $13 billion 30-year Treasury bond auction yesterday came in at 4.52%, more than the expectation of a 4.48% yield, and was described at ZeroHedge.com as being the ugliest 30 Year Auction This Year.
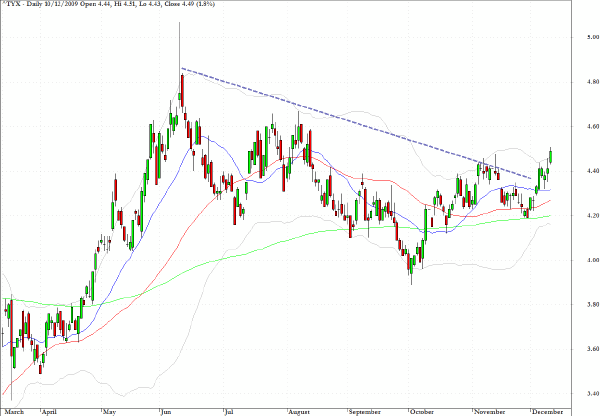
From a technical point of view, the penetration through the descending trend line through recent highs, although it has given false signals previously over the last year, is something which the Fed and Treasury will have to monitor carefully in regard to the financeability of the mountains of long-term Treasuries contemplated by the US.
Zero Hedge’s outspoken postings, written under the pseudonym of Tyler Durden, are often designed to be deliberately provocative but the following point regarding the yield curve which was made following yesterday’s auction could present difficulties in trying to push out the average duration on US government debt.
Just in case there is anyone still doubting what an impact the Fed’s intervention in the bond market has had courtesy of the first (soon to be followed by second) QE program, one needs look no further than the 2s30s curve, which, at 372 bps is now the widest it has been in thirty years. However, regardless, of how one interprets Bernanke’s indirect market manipulation, one thing is sure - investors are walking, no running, for the hills when it comes to the long-end of the curve. We wish Geithner all the best in his attempt to issue hundreds of billions of debt with a tenor greater than 10 years.
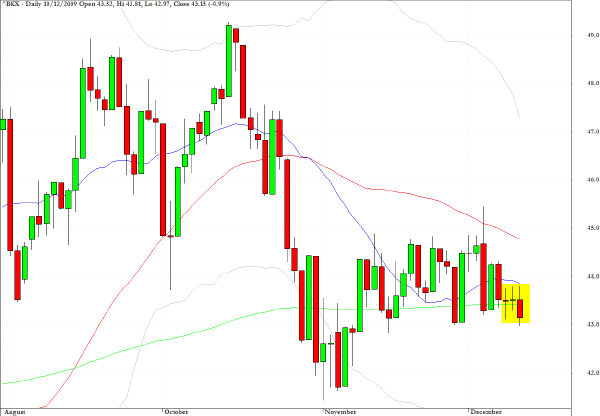
It’s time to come to the rescue of the banking sector as the KBW Banking Index (BKX) has slipped below the 200-day EMA. A retest of early November lows may be in store, but perhaps a Santa rally continuation will help to sprinkle some fairy dust over the sector as the refunding of those banks wanting to repay the TARP is still not completed.
Overall positive sentiment could well prevail again for equities today as the US dollar seems to be reverting to its default mode of sliding against key currencies, even though there have been some suggestions in recent sessions that those short the dollar are getting a little more jumpy.
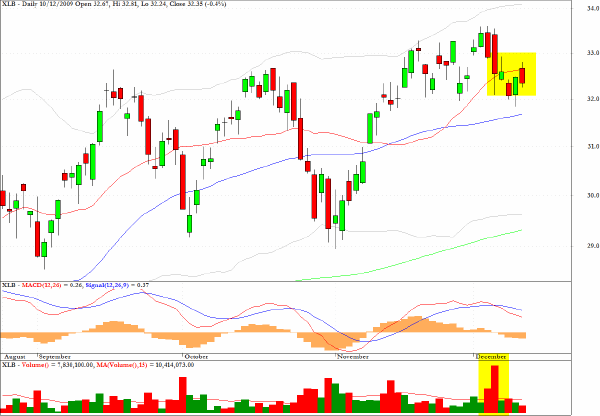
XLB, has a mini bear flag formation.
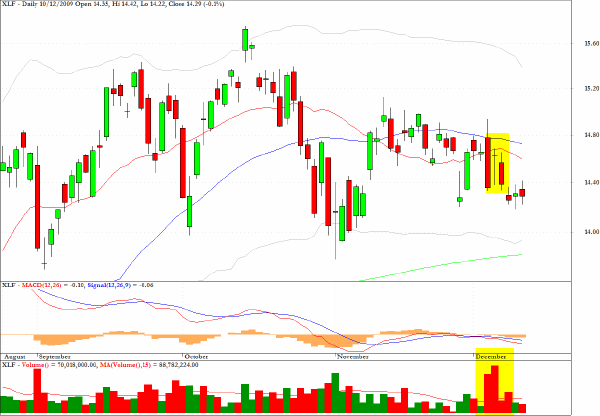
XLF, the exchange traded fund which tracks the financial services sector, could be headed toward the 200-day EMA but its fate will be intertwined with that of the banking sector as already discussed.
Cummins Engine (CMI) has a bearish pullback formation which could now find resistance at the intersection of two moving averages.
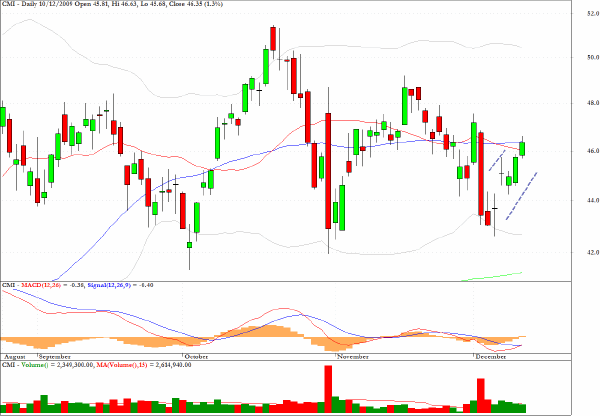
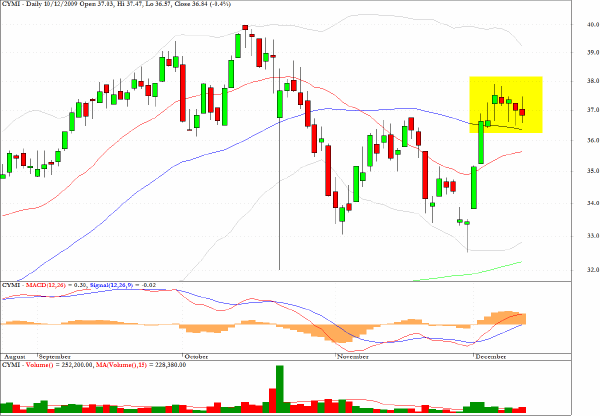
Cymer (CYMI) has a bullish pullback pattern.
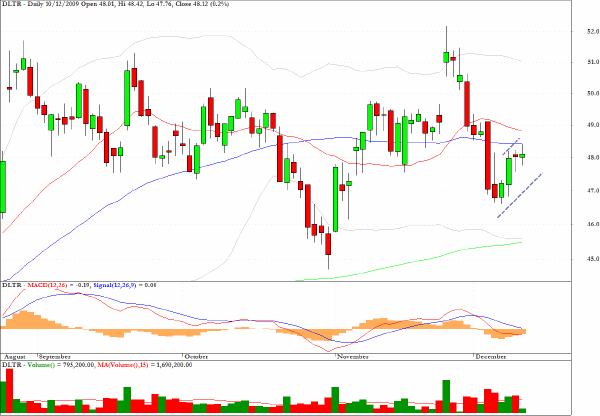
Dollar Tree Stores (DLTR) looks vulnerable to further weakness.
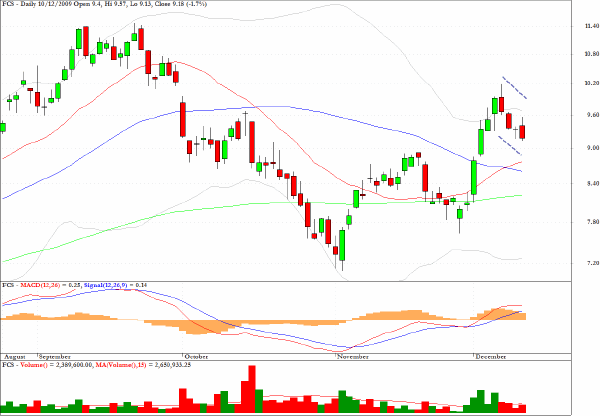
Fairchild Semiconductor (FCS) is pulling back following recent advances on strong volume and the $10 level seems to be a feasible intermediate-term target.
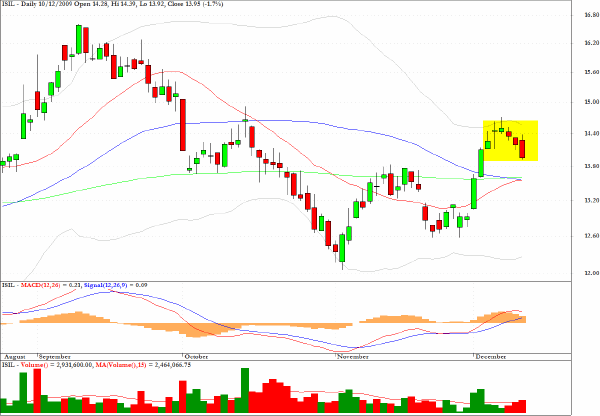
I would also be looking at the long side on Intersil (ISIL) as it approaches the intersection of all three moving averages.
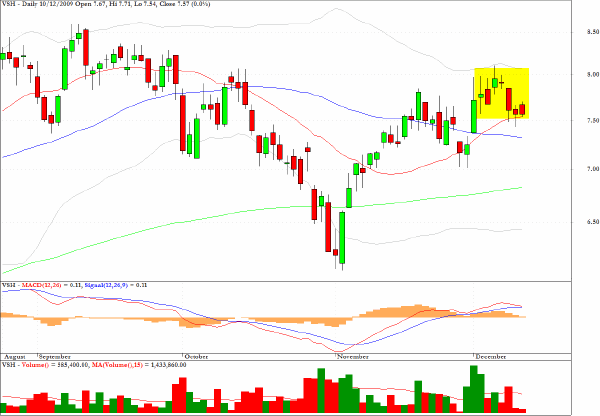
Vishay Technology (VSH) has consolidated following recent surges on substantial volume and an entry at $7.50 with a profit target around $8 could be a short-term play.
Clive Corcoran is the publisher of TradeWithForm.com, which provides daily analysis and commentary on the US stock market.
|