NASDAQ COMMENTARY
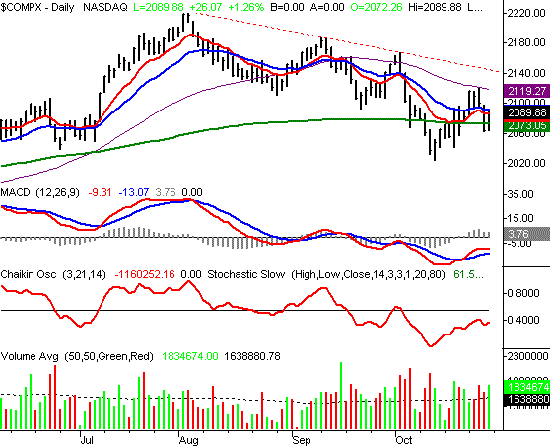
The NASDAQ Composite, believe it or not, made a small gain last week. The close at 2089.88 was 7.67 points above last week's close of 2082.21. That 0.3% rally is minimal to be sure, but any progress is technically bullish. Plus, there are a handful of other chart patterns that suggest we're headed higher as well. Unfortunately, there are just as many barriers to bullishness.
After a nice start to the week, the bulls' hopes were shattered on Wednesday and Thursday when the NASDAQ fell to the week's low of 2063.81 after reaching a high of 2121.36. Thursday's close at that day's low was also under the 200 day line (as well as all the other moving averages), wiping away all of the bullish crossovers we had just seen a few days earlier. But the sellers weren't around on Friday, allowing the buyers to push the index back above the 200 day line as well as the 10 day line. So in that regard, there once again is a glimmer of hope for the bulls. However, we technically need a second close above both of those lines before that buy signal is complete.
On the other hand, the NASDAQ is still under the 20 and 50 day lines. That's bearish. Oh yeah, the 50 day line was where the pullback all started, when it was touched on Wednesday with the composite's high of 2121.36. For that reason, we really need to see a close above 2119.27 - where the 50 day average currently is - to confirm that the bulls can get things going.
That said, the volume trend remains bullish. The Chaikin line is still pointed higher, although it's still under the zero line. Plus. Friday's bullish volume was greater then Thursday's selling volume. That was a statement from the bulls to the bears that the buyers are still bold, and numerous. Given the choice between being in the market or out of the market over the weekend, most chose to be in the market. For that reason, we have to think that the buyers will continue to build on the week's gains. However, we'd prefer to get that close above the 50 day line before buying in. And really, a close above the resistance line (dashed) at 2144 would be the safer confirmation.
NASDAQ CHART - DAILY

S&P 500 COMMENTARY
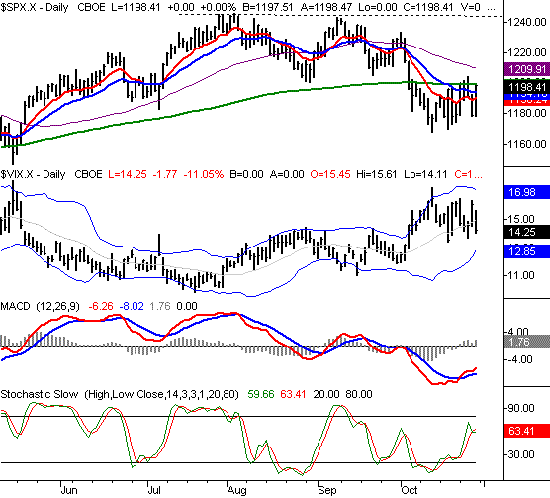
The S&P 500 close at 1198.41 last week was 18.9 points higher than last week's close at 1179.59. That 1.6% gain was only made thanks to Friday's 9 point rally, but as with the NASDAQ, any gain is bullish. In fact, this momentum is clearly more bullish than the NASDAQ's is. But like the NASDAQ, the SPX is trapped in between bullishness and bearishness.
The S&P 500 closed back above the 10 and 20 day averages by the time the week came to a close, so we're at least on our way to a short-term bullish signal. However, keep in mind that we made a close above the 10 and 20 day lines on Tuesday, only to fall back the rest of the week. For that reason, we're still cautious. We need to at least see a second close above the 10 and 20 day lines to get bullish in the short run.
However, there are still a couple of long-term barriers in the 200 and 50 day averages. In fact, the 200 day line was where the rally stopped on Friday, with that day's high of 1198.41. That 200 day line was also a problem earlier in the week, so again, we need a little more convincing. As if that weren't enough, we don't really know what's going to happen when and if we get to the 50 day line at 1209.9....we haven't been there in about a month.
That said, we still have to lean with the bulls this time around. The index made a pretty big gain for the week, widening the divergence on our already-bullish MACD chart. Plus, the VIX is also falling for the time being. It may be ugly, but the momentum is technically to the upside.
S&P 500 CHART - DAILY

DOW JONES INDUSTRIAL AVERAGE COMMENTARY
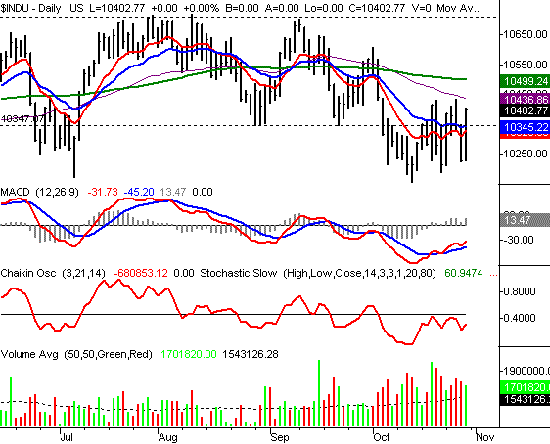
The Dow Jones Industrial Average closed at 10402.77 last week, gaining 187.55 points from the prior weekly close of 10215.22. That's a 1.8% gain for the week, making the Dow the biggest winner of the week. Yet, the Dow still faces the same problems that the other two indexes face - resistance at the 50 and 200 day averages.
Like all the indexes, Friday's cross above the 10 and 20 day lines is bullish, making good on last week's bullish MACD crossover. And the volume has stayed generally bullish too. But from here, we'd like to see a couple of closes above the 200 day average to really get excited. It's less than 100 points away right now, so it shouldn't take much find out how convicted the bulls really are. So while we're optimistic here as well, the Dow is also something of a question mark until the 200 day average is breached.
DOW JONES INDUSTRIAL AVERAGE CHART - DAILY

Price Headley is the founder and chief analyst of BigTrends.com.