| Corcoran Technical Trading Patterns For December 14 |
| By Clive Corcoran |
Published
12/13/2009
|
Stocks
|
Unrated
|
|
|
|
Corcoran Technical Trading Patterns For December 14
European markets on Monday morning have moved upwards on a sigh of relief that Abu Dhabi has come to the rescue of the world’s leading example of a submerging market venture - the Palm Tree Island project in the gulf at Dubai.
What is quite remarkable about this relief rally is that the troubles facing Dubai World had already been discounted last week as inconsequential for world markets. So we got two rallies for the price of one!
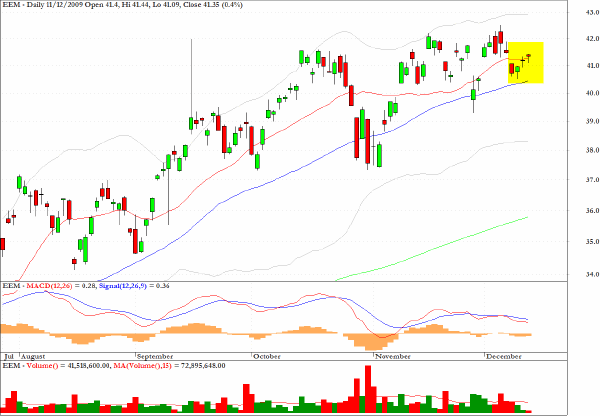
The sector fund EEM, meanwhile, seems to be struggling to regain its upward momentum and traders may be keeping a closer eye on the US dollar which seems to be showing a little more signs of life than its previous appearance of rigor mortis was suggesting.

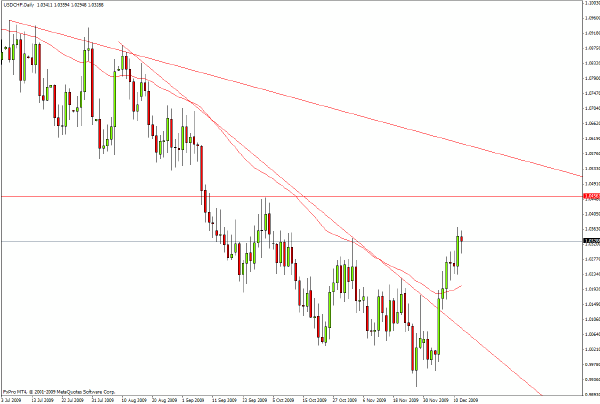
The key level to watch for on the USD/CHF chart would be a break above 1.047. The Swiss franc most reliably tracks the Euro/USD relationship so, from the perspective of the EUR/USD cross rate, the $1.45 level seems to be a possible target this week - and there is mounting technical evidence that this previously strong support level for the eurozone currency may not hold.
As I commented elsewhere this weekend, the biggest problem facing the ECB is whether to continue accepting government paper from all of the EZ states as equivalently priced for risk, i.e. with no differentiation for the AAA borrowers (France and Germany) or the BBB+ paper of Greece and also some other "problematic" credits from Ireland, Spain, Italy etc.
Any sign of dismemberment of the EZ bloc - e.g. if Greece had to leave - would be a major disruption in the global capital markets and not as easily dealt with as the troubles of Dubai World or the collapse of the Icelandic economy.

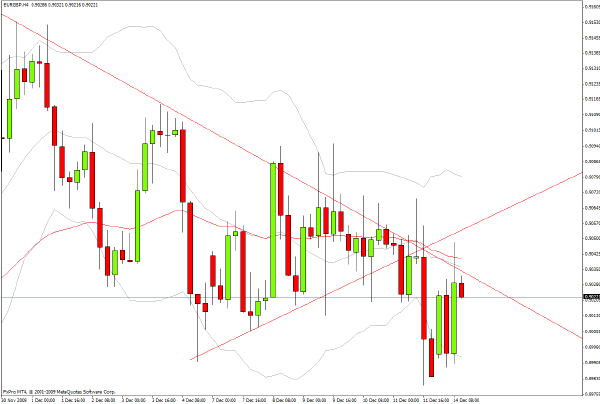
While the European currencies gyrate against the dollar, the real sideshow is the EUR/GBP cross rate which continues to confuse and confound many day traders. I would rather watch from the sidelines at the moment on this pair.

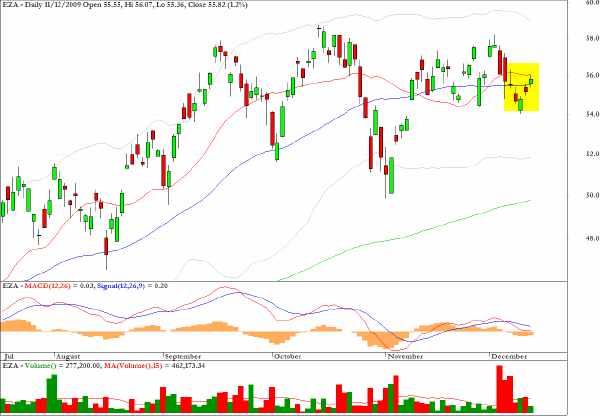
EZA, an exchange traded fund which tracks the iShares MSCI South Africa Index, is, echoing the EEM pattern reviewed above, showing evidence that the larger volume coming into the fund is associated with down moves and the pullback is on much lighter volume.

Clive Corcoran is the publisher of TradeWithForm.com, which provides daily analysis and commentary on the US stock market.
|