| Corcoran Technical Trading Patterns For December 15 |
| By Clive Corcoran |
Published
12/14/2009
|
Stocks
|
Unrated
|
|
|
|
Corcoran Technical Trading Patterns For December 15
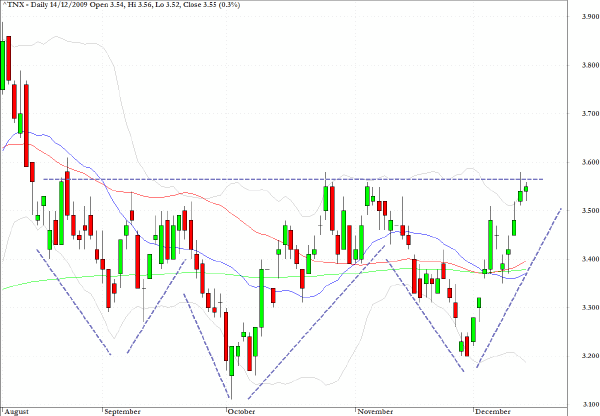
The daily chart showing the yields on the US 10-year Treasury Note is displaying an intriguing pattern which bears some resemblance to the inverted head and shoulders pattern that was evident on the spot gold chart in early October.
One other intriguing feature which has been emerging is the widening of the 2/10 spread whereas there has been a slight contraction in the 2/30 spread. There could be numerous strategies at work as regards future expectations of the shape of the yield curve, but if the exit, in general, from longer-dated maturities is being stage-managed through short-term arbitrage strategies, then the eventual move up in yields for all longer-dated Treasuries may not be as orderly as the Fed and the Treasury would prefer.

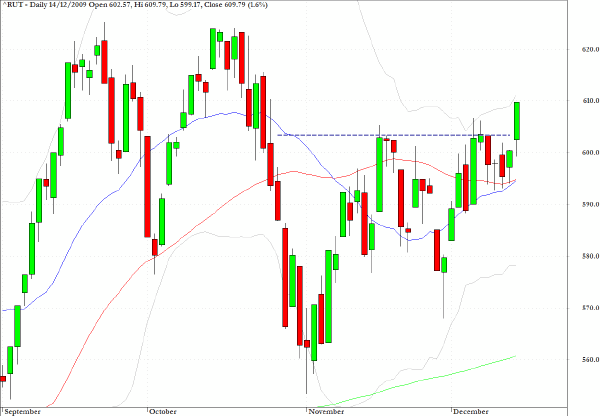
As anticipated here last week, the Russell 2000 is enjoying some late year enthusiasm with a 1.6% gain yesterday whereas the S&P 500 could only manage one half of that increase. The renewed vigor of the high beta stocks, however, needs to be considered alongside evidence that many portfolio managers seem to be migrating to the large-cap defensive stocks including the utility stocks as discussed below.

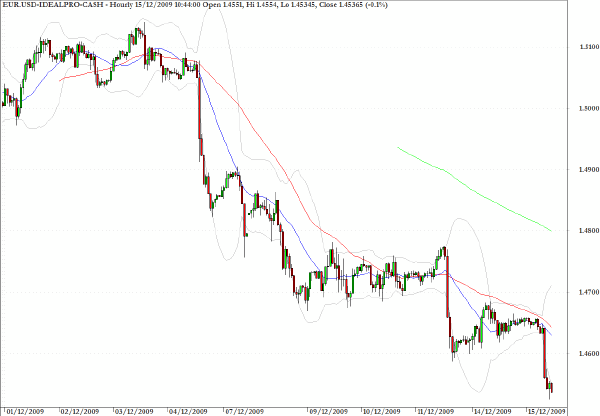
The hourly chart for the EUR/USD since the beginning of December shows that large FX players are quite keen to exit this pair with very little attempt to conceal their efforts with any of the normal counter-trend relief rallies.
As we reach towards the $1.45 level in European trading this morning, which I anticipated in last week’s commentary, there should be support for the Eurozone currency. If that support were to fail to arise, this would indicate that there are some large institutional sellers who may have information regarding the internal dynamics of the European Monetary Union, and the financial conditions within some of the member states, which have not been widely recognized by many traders focused on equities.

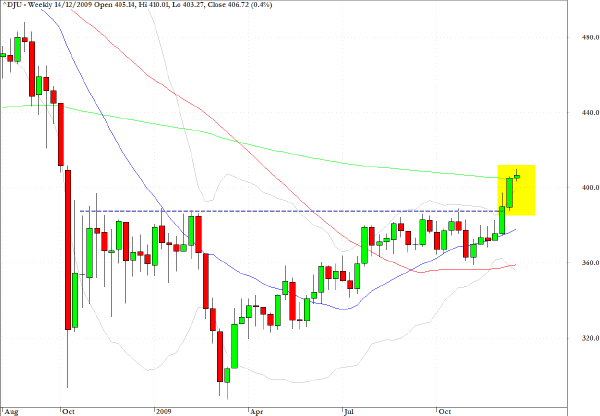
The movement up in the utility stocks, as reflected in the weekly chart for the Dow Jones Utilities Index, shows that the last two weeks have seen a clear break above a key resistance level. The action in this index adds some conviction to the bullish case for equities in general, but is somewhat incongruous with the potential for higher yields on the long end of the Treasury yield curve and also with the search for higher beta as revealed in the strength of the small cap stocks.
Also evident on the chart is the attainment of the 200-week EMA which has still to be registered for the S&P 500. The cross currents at work in US equities at present may have a lot to do with the difficulties of disentangling the rather confusing evidence relating to the economic recovery pattern and the outlook for intermediate-term monetary policy.
On this issue the following recent comments from Stephen Roach of Morgan Stanley are quite revealing:
The Fed is the “weak link” among central banks and may fail to tighten monetary policy in time to stop asset bubbles from forming, Roach said at a conference in Berlin today. The Fed helped trigger the boom and then bust of the subprime mortgage market by being “quick to slash, slow to normalize” interest rates, he said.
“There is a great risk in the coming exit strategy,” said Roach, a former Fed economist. “They are lacking primarily a political will to execute the exit in a timely and expeditious fashion that will avoid the mistakes of the last crisis.” The traditional view of central bankers that asset bubbles are hard to spot and deflate with rates is “ludicrous,” he said.
“This is a failed flaw in the intellectual construction of modern central banking that must be addressed,” said Roach. “If we don’t fix this problem we’re doomed to repeat the failed asymmetric policies of the past and set ourselves up” for another crisis.

Clive Corcoran is the publisher of TradeWithForm.com, which provides daily analysis and commentary on the US stock market.
|