| Corcoran Technical Trading Patterns For December 18 |
| By Clive Corcoran |
Published
12/18/2009
|
Stocks
|
Unrated
|
|
|
|
Corcoran Technical Trading Patterns For December 18
The broad-based selloff in equities yesterday should be primarily attributed to the newfound strength in the US dollar and, as discussed here yesterday, this almost allowed the USD/CHF to pierce a key target set here recently of $1.045.
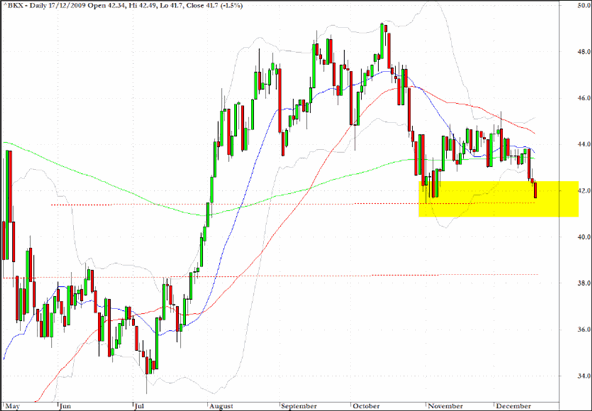
There could well be a digestion of recent gains for the dollar today and my attention will be on the KBW Banking Index (BKX) which has returned to a key support level as indicated on the daily chart below.
Whether or not this index, and the financials in general, are able to mount a relief rally near to current levels will, in my opinion, be as important as the FX background (and they are related) in determining the near-term direction of US equities.
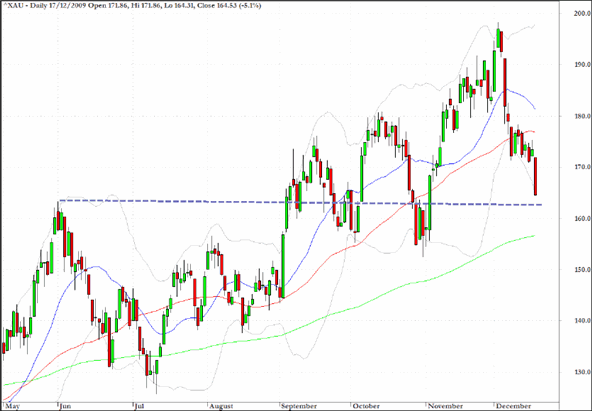
Another major casualty of the recent dollar strength has been spot gold but as the chart below for the Gold and Silver Index (XAU) reveals, this index is now approaching an area of potential price support as well as the 200-day EMA.
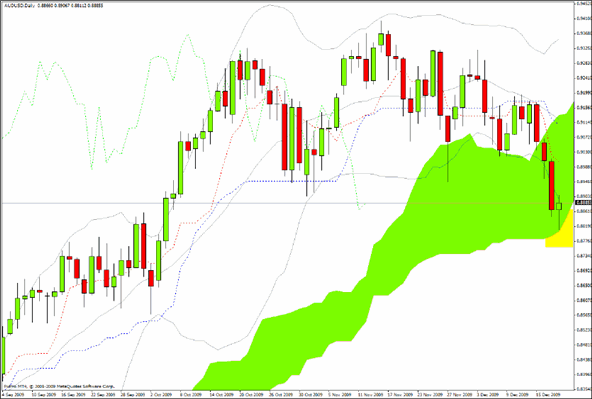
The Australian dollar fell to exactly the level anticipated in yesterday’s Ichimoku chart pattern.
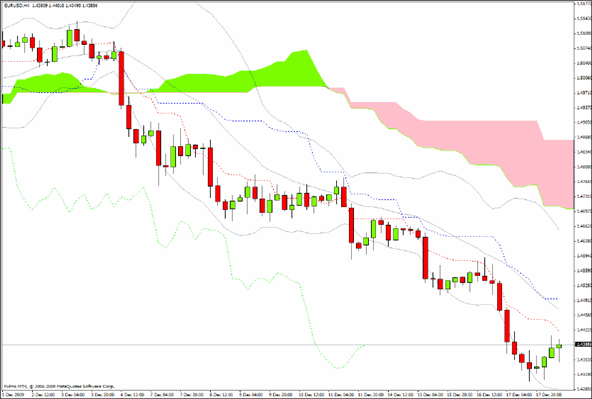
The four-hour chart for EUR/USD shows just how little buying interest there is currently in the Eurozone currency and, should there be a rally back towards the $1.45 level, I would suspect that this will bring out the sellers in force again.
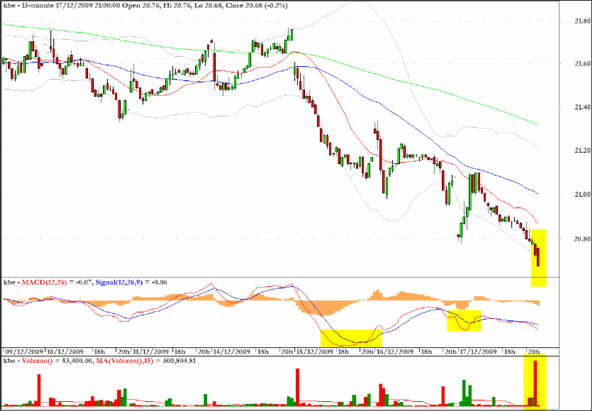
KBE, which is the exchange traded tracker of the KBW Banking Index, should be monitored today on the intraday chart patterns (I would suggest the 15-minute chart) for signs that a positive MACD divergence could provide a tradable bounce for today’s session.
However, the evidence on the daily chart at present is still not compelling, and this will be a task for Monday’s column (which will be my last for 2009).
I shall repeat my thoughts from Wednesday regarding JP Morgan.
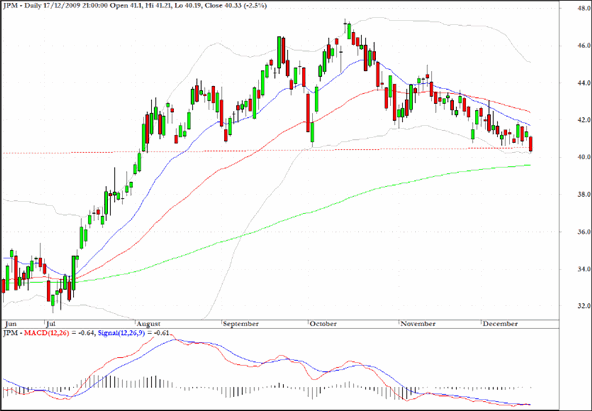
JP Morgan (JPM) has also reached back to a key level just above $40.50. Even though the chart reveals a dome like appearance, this could be a reasonably attractive trade on the long side with a stop loss level around $39.30 which also coincides with the 200 day EMA and an upside target around $43.80 which would provide a 2:1 reward/risk ratio.
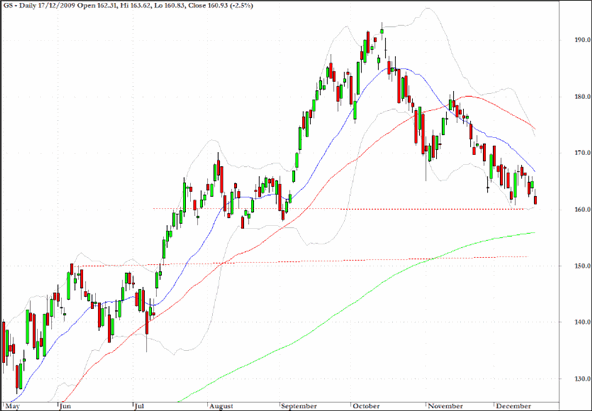
Goldman Sachs (GS) has continued to decline in what is increasingly taking on the appearance of a downward wedge pattern. The stock would appear to be well-supported just above the $150 level and appears to face strong resistance from the downward trendline through the highs since topping in mid-October.
Clive Corcoran is the publisher of TradeWithForm.com, which provides daily analysis and commentary on the US stock market.
|