| Corcoran Technical Trading Patterns For December 21 |
| By Clive Corcoran |
Published
12/21/2009
|
Stocks
|
Unrated
|
|
|
|
Corcoran Technical Trading Patterns For December 21
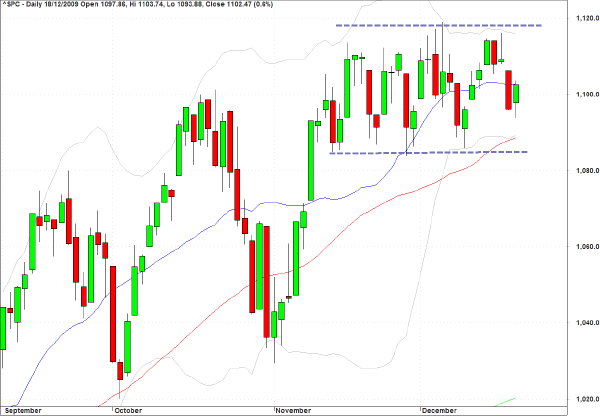
As we move into the quieter trading for the remainder of the year, the S&P 500 seemingly has entered a sideways trading range within a "safe" zone between 1085 on the lower boundary and 1120 above. The near-term movements in the US dollar will continue to force the pace I suspect, and the real test for the bullish argument would be a continued decline in the euro below the $1.4180 level which I anticipate as the next major area of support for the Eurozone currency. If that does not provide firm support and the S&P 500 drops below 1080, then there could be some more serious selling of US equities as the end of the year approaches.
Ambrose Evans Pritchard, one of my favorite financial journalists, who is a Eurosceptic, at least with regard to the currency union, had the following comments about the European Monetary Union in today’s Telegraph.
The EMU system has condemned Club Med (i.e. the southern European nations) to structural depression, with no way out.
Eurosceptics argued from the start that EMU would prove unworkable over time without a debt-union; that the inevitable euro crisis would be used (consciously or not) to create an EU central government; that weak states on the edges would be reduced to colonies and that far from binding Europe together, EMU would lead to acrimony and perhaps reopen Europe’s can of historical worms. Were the critics wrong?
It may seem odd to be linking this to the graphic for the S&P 500 but the current fragility of the euro and the growing distaste of the Chinese to be too reliant on using the US dollar as its largest reserve currency are inter-linked and will probably be large factors in determining the appetite for US equities during 2010.
This is my last letter for this year and I would like to wish all of my readers the very best for the holiday season and good fortune in 2010.
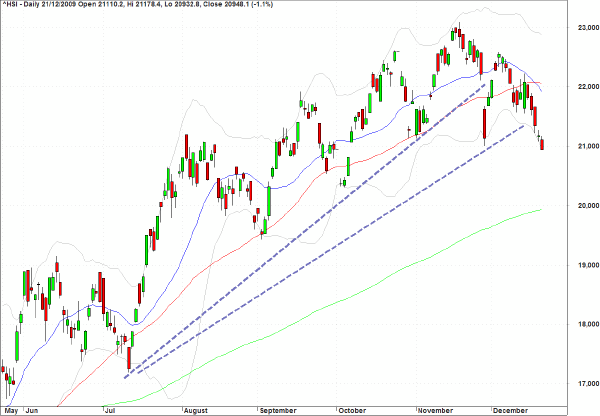
The Hang Seng Index (HSI) has continued its slide and could now be set for a revisit to the 20,000 level.
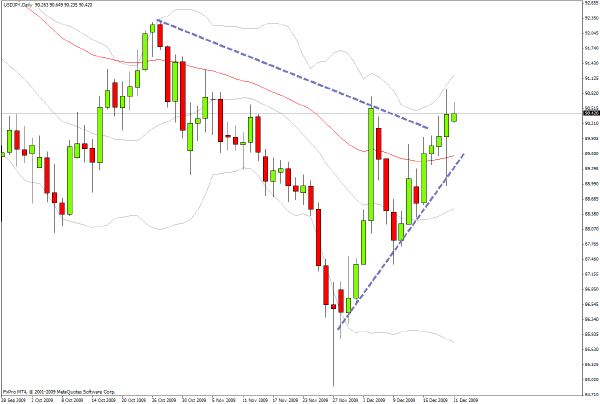
The chart pattern for the USD/JPY looks constructive for US dollar bulls, and a return to the 92.30 level would seem to be an attainable target in coming sessions.
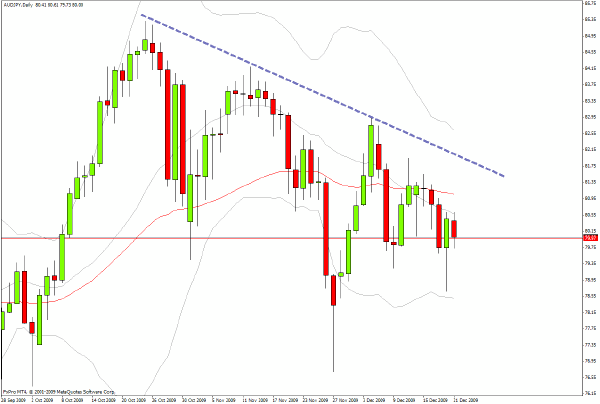
In the light of the comments above, another key FX cross rate to be monitoring over the coming weeks will be the AUD/JPY rate which I have discussed numerous times here during the last few weeks. There is emerging evidence of a descending wedge pattern and if this rate were to drop below the 76.50 level (as almost touched on the session following US Thanksgiving and linked to the Dubai World announcements) this would pose increasing problems for the FX carry trade which still seems to be carrying the torch for risk assets.
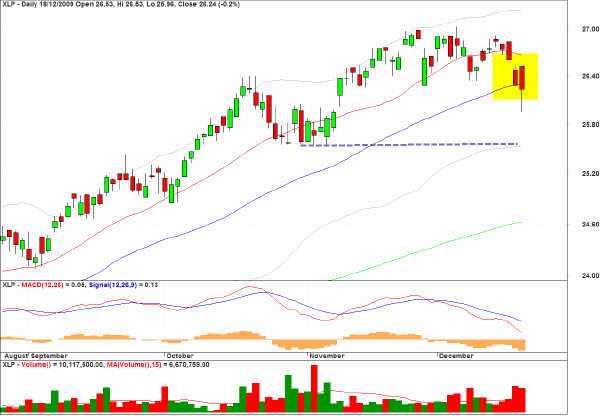
XLP, the exchange traded fund for consumer staples stocks, appears to be attracting sellers near its recent highs.
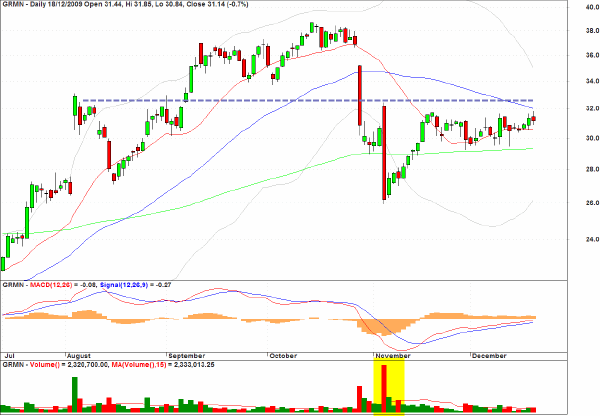
Garmin (GRMN), has been in an extended pullback phase since large losses on heavy volume but seems to be unable to regain a footing above key resistance levels.
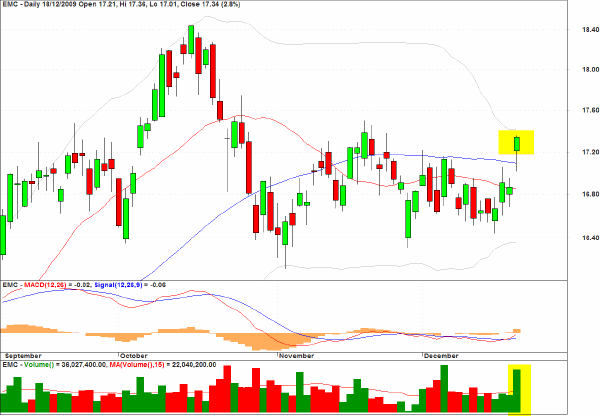
EMC shows bullish range expansion on substantial volume following an inside pattern last Thursday. This is often a bullish indicator and I would be targeting higher prices in coming sessions.
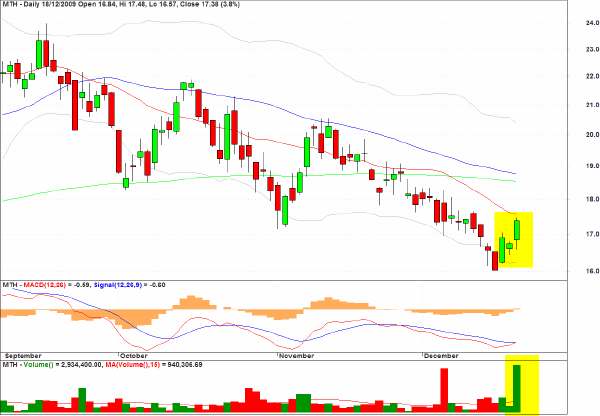
Meritage Homes (MTH) displays a similar pattern to that seen for EMC and should be good for a move towards the $19 level.
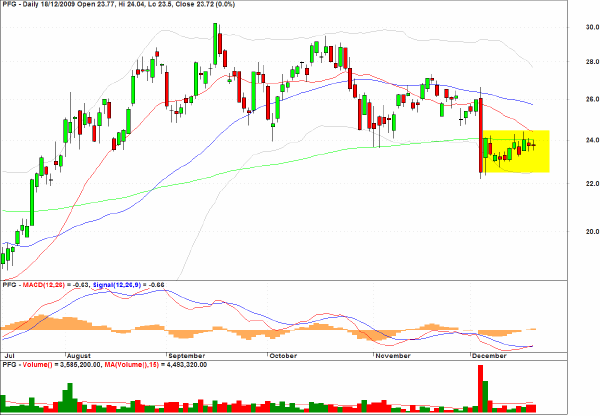
Principal Financial Group (PFG) has a bearish pullback channel and would seem to be hard pressed to move back above the convergence of the 50 and 200-day EMA’s.
Clive Corcoran is the publisher of TradeWithForm.com, which provides daily analysis and commentary on the US stock market.
|