I suppose since I'm sharing my trading biases I should have a better idea of what this periodic end-of the-month index price alteration is all about. I'm referring to the fact that sometimes on the last day of the month, the exchange posts an official closing price that is in left fieldâ€"often completely outside the closing price range, and sometimes several points away from the last tick.
Today may be the most extreme example ever. The last tick in the mini S&Ps was 120325. The official settlement was 120975. (SIX AND A HALF POINTS!!) I'm told it has something to do with adjusting the index to keep in line with stocks or something or other. (Actually, I suspect it has more to do with the fact that the powers that be always want to put the most bullish face possible forward. God knows whyâ€"do we really believe we're going to suspend the natural laws of economics?)
I'm being a little tongue-in-check here. “Little” is the operative word.
My esteemed colleagues seem as perplexed as I am. I have reliable information sources in general, but no one no can shed definitive light on this little maneuver.
The differential though, obviously affects my signals. I can't imagine any mechanical trader not struggling with the same issue. I'm going to have to reluctantly accept the goofy official closes. Doing anything else would necessitate hours of readjusting spreadsheets and probably getting inaccurate results from so much manual interference. Besides that, all historical testing incorporates official prices. What else would you use if you were looking back in history and didn't know any better?
This is one of those one-time anomalies we're stuck with. I would suggest taking my posted daily indicators in the S&Ps, Nasdaq and Russell with a large grain of salt.
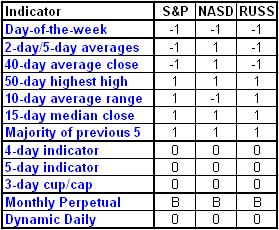
Dynamic Monthly Biases for November 1
Hold longs in all indexes.
The bottom two rows determine the signal. Dynamic Day One trumps everythingâ€"you always follow it. When it's neutral, the Monthly Perpetual provides the direction. Click here for a more in-depth explanation of the rules.

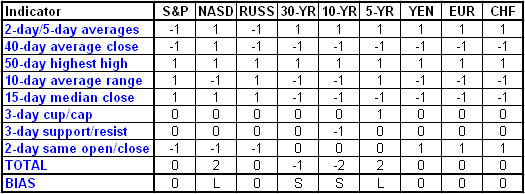
Daily CzarChart for November 1
The bottom row provides the direction of the bias at the open: long (L) or short (S). When it's neutral, it will read zero (0). Click here for a more in-depth explanation of the rules.

DISCLAIMER: It should not be assumed that the methods, techniques, or indicators presented in this column will be profitable or that they will not result in losses. Past results are not necessarily indicative of future results. Examples presented in this column are for educational purposes only. These set-ups are not solicitations of any order to buy or sell. The author, Tiger Shark Publishing LLC, and all affiliates assume no responsibility for your trading results. There is a high degree of risk in trading.
Art Collins is the author of Market Beaters, a collection of interviews with renowned mechanical traders. Art is speaking at the Las Vegas Traders Expo in December. E-mail him at artcollins@ameritech.net.