| Corcoran Technical Trading Patterns For January 5 |
| By Clive Corcoran |
Published
01/5/2010
|
Stocks
|
Unrated
|
|
|
|
Corcoran Technical Trading Patterns For January 5
2010 began with a strong showing from the financials and broad support for equities in general with the S&P 500 breaking above the 1130 level which had eluded it during the last few trading days of 2009.
My biggest concern for financial markets during this coming year is the sovereign debt market in general, and in particular, the long end of the US Treasury yield spectrum and even more pointedly the equivalent sector for UK gilts.
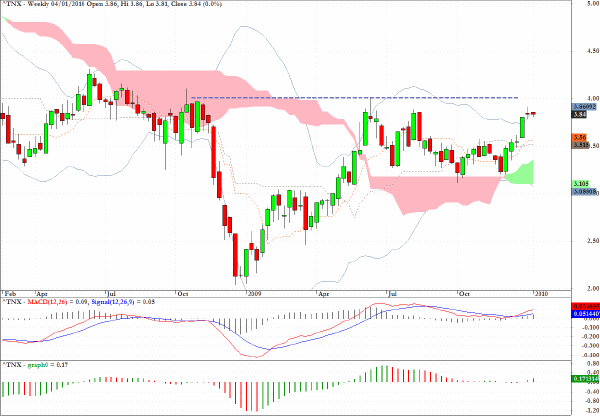
The weekly chart which tracks the yield for the ten-year US Treasury note reveals that a break through the 4% barrier (which I anticipated in one of my comments at the end of 2009 based upon the inverted head and shoulders pattern) now seems just a matter of time. This would mean that yields on this benchmark security would have doubled since the end of 2008 (just over a year ago!).
Here are some comments that I made regarding long term interest rates in my Outlook for 2010 which was re-published by SeekingAlpha and is available here.
I expect the yield on the 30-year Treasury to get to 5% in coming weeks and a six percent coupon is quite conceivable during 2010 for this maturity if, as announced, the US Treasury continues its attempts to push out the duration of its new issuance.
According to one source 40% of all Treasury debt matures within a year - which is extraordinarily problematic in itself - and Treasury Secretary Geithner is on record as saying that the Treasury will be managing its issuance in coming years with a view to selling more long term securities... it clearly has to, so as to avoid the classic mismatch between the long term US government obligations and a very short term funding horizon.
According to Morgan Stanley estimates, the Treasury will have to sell a record $2.55 trillion of notes and bonds in 2010, an increase of about $700 billion, or 38 percent, from this year.
If anything the yield curve could get steeper - and will be influenced as much by growing risk aversion of the long end of the yield curve as by any upward trend in short and medium term rates.
The situation in the UK I would suggest is even more precarious and if the Bank of England holds to its recent announcement that it will suspend QE in February there is a real risk that the gilt market may suffer a failed auction which could be politically embarrassing to the existing government in an election year.
As yet another drag on long term government bonds PIMCO’s Paul McCulley has indicated that they will most likely be net sellers of long term US and UK Treasuries during 2010.
Even though equity markets can move out of sync with underlying economic fundamentals as was witnessed during 2009, the big unknown - for which I have not yet found a satisfactory answer is - where is the demand for all of the debt that both governments need to sell going to come from?
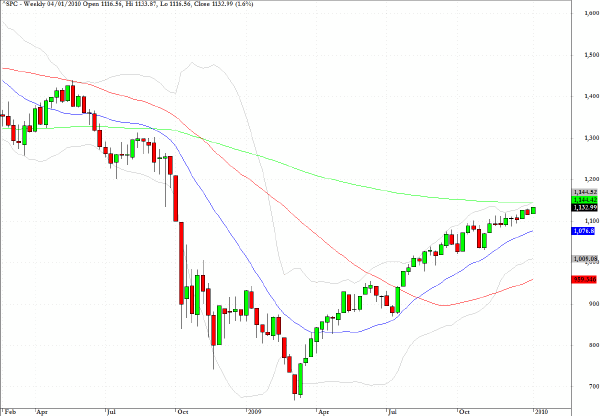
The weekly chart for the S&P 500 reveals that the index has reached back to its 200-week EMA (i.e. four trading years) and this could pose some resistance to progress in the near term.
Here are the comments which I made regarding US equities in my 2010 outlook previously referenced.
I see the S&P 500 hitting both 1280 and 870 during 2010, and it seems more likely that the 1280 comes in the first half and the 870 comes during the summer months or second half of the year. Both are key technical levels, as seen on the chart below, and the timing will have to do with the market’s perception of when the Fed is planning to exit its super-accommodating monetary policy. I am sure there will be some significant missteps regarding the exact timing and mechanics of the exit strategy, and traders as well as the Fed itself could easily become confused by the economic data and the underlying strength of the banking system.
However, at some point during 2010, unless there is another systemic crisis, the Fed will have to begin raising short term rates and draining liquidity from the financial system to maintain any semblance of credibility. At the first real evidence that the die is cast in favor of higher rates, the market, which prides itself on its ability to discount all known information, will suddenly realize that it has not fully discounted the actuality of higher rates and will, almost certainly, panic. There could easily be a series of nasty sell-offs and that is why I anticipate a re-testing of the July 2009 lows around 870. Should this level fail, which I tend to think will not happen, then an S&P 500 level with a seven as the first digit becomes a real possibility.
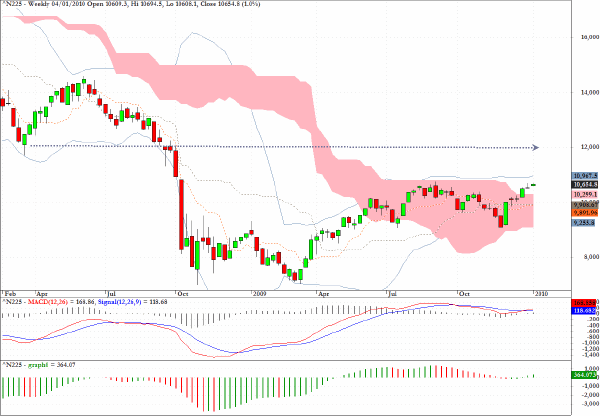
The weekly chart for the Nikkei 225 shows that a move up towards the 12,000 level appears more probable from a technical perspective since the Japanese government mounted a serious rescue remedy for the index when it threatened to break below 9000 in late November 2009. That latter level would now seem to represent a line in the sand for traders as a drop below that would be extremely negative for this market.
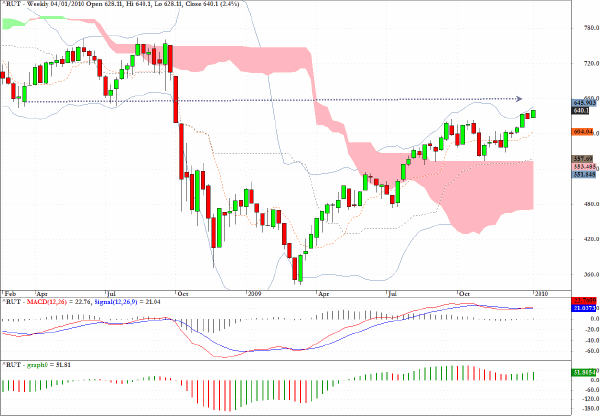
High beta has been delivering again but the Russell 2000 (RUT) should face stiff resistance at the 660 level.
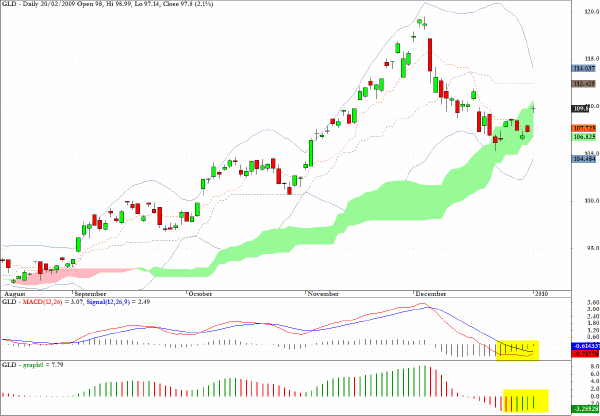
The exchange traded fund, GLD, which tracks the price of the precious metal has recovered from the rather aggressive bout of selling which arose during December.
Reviewing the weekly Ichimoku pattern the key test for the metal (which I expect it will be able to meet) will be to break decisively above the cloud formation and resume its upward momentum.
I am still of the view that $1320/50 is attainable within the next few months.
With the onset of the New Year the forex markets seem to have resumed their dollar bashing posture but there is a lot of cross rate trading taking place beneath the surface of the major exchange rates with the US dollar.
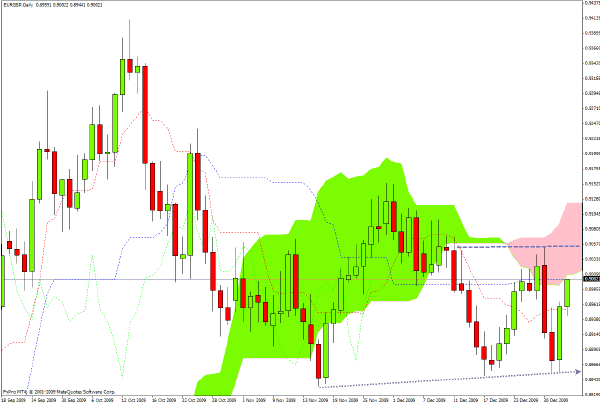
One key pair which I have focused on is the rate between sterling and the euro and, although I believe that eventually both are headed down against the dollar in the intermediate term, it is becoming more likely that sterling will be even weaker than the euro. Reviewing the EUR/GBP chart there is evidence of a triple bottom in place - with slightly higher lows - and if the pair crosses the 9050 level again and breaks through the Ichimoku cloud then attempts to retest parity will be back on the agenda for the major FX players.
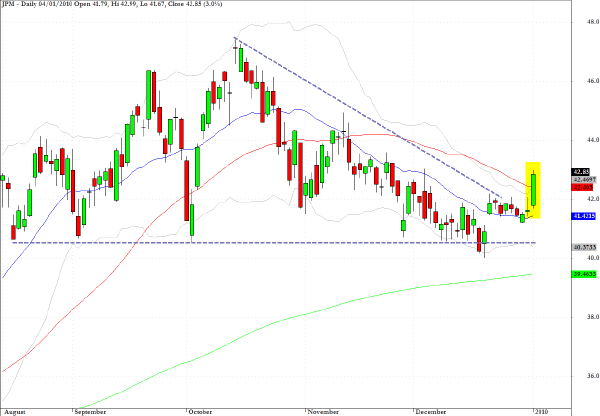
JP Morgan (JPM) moved up decisively yesterday, and would appear to have been rescued from the descending wedge pattern that was developing for this bank and Goldman Sachs (GS) at the end of last year. I shall repeat my trade recommendation from my last newsletter of 2009 and would suspect that we could see the pattern complete in coming sessions.
JP Morgan (JPM) has also reached back to a key level just above $40.50. Even though the chart reveals a dome like appearance, this could be a reasonably attractive trade on the long side with a stop loss level around $39.30 which also coincides with the 200 day EMA and an upside target around $43.80.
Clive Corcoran is the publisher of TradeWithForm.com, which provides daily analysis and commentary on the US stock market.
|